Fisher Transform Dynamic Threshold Trend Following Strategy

Overview
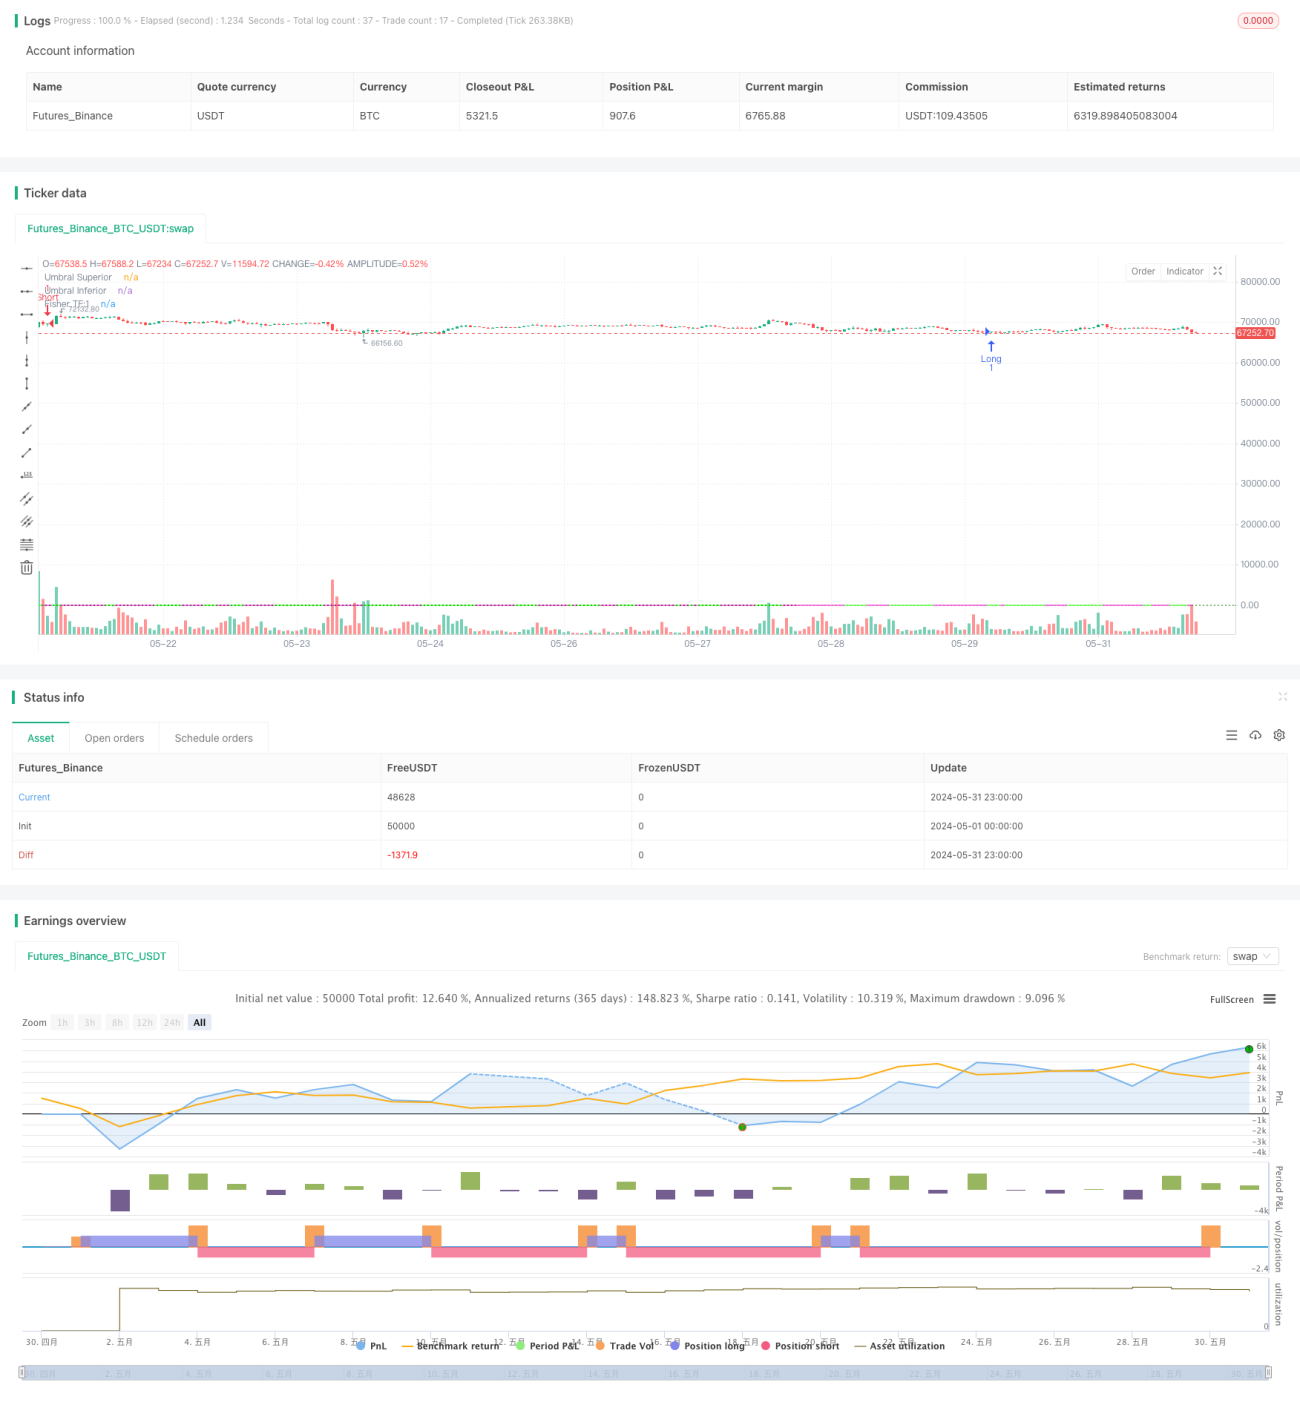
The Fisher Transform Dynamic Threshold Trend Following Strategy utilizes the Fisher Transform indicator to identify changes in price trends. The strategy uses the Fisher Transform to normalize prices to a standard scale, making it easier to detect potential trend reversal points. By dynamically adjusting thresholds, the strategy adapts to different market conditions and improves the accuracy of trend recognition. When the Fisher Transform value crosses positive or negative thresholds, the strategy generates buy or sell signals to follow market trends.
Strategy Principle
- Calculate Fisher Transform value: Based on historical high and low prices, normalize the current price to obtain a Fisher Transform value between -0.999 and 0.999.
- Dynamic threshold: Dynamically adjust the threshold for buy and sell signals based on the historical volatility of the Fisher Transform value to adapt to different market states.
- Trend determination: Determine changes in price trends by comparing the current Fisher Transform value with the values from the previous two periods.
- Buy and sell signals: Generate a buy signal when the Fisher Transform value crosses the negative threshold from below, and generate a sell signal when the Fisher Transform value crosses the positive threshold from above.
Advantage Analysis
- Dynamic threshold adjustment: Adaptively adjust buy and sell thresholds based on market volatility to improve the accuracy of trend judgment.
- Trend tracking: The Fisher Transform indicator's trend judgment enables effective capture of market trends and trend-following trading.
- Reduced price noise: The Fisher Transform normalizes prices, helping to reduce the impact of price noise on trend judgment.
- Intuitive chart display: The strategy plots the Fisher Transform curve and threshold lines on the chart, allowing traders to visually observe market trends and buy/sell signals.
Risk Analysis
- Parameter optimization risk: The strategy's performance depends on the selection of parameters such as the Fisher Transform period and the dynamic threshold calculation method. Different parameters may lead to different trading results.
- Trend recognition lag: The Fisher Transform indicator has a certain lag in judging price trends, which may miss some trend movements.
- Poor performance in choppy markets: In choppy market conditions, frequent trend changes may cause the strategy to generate more false signals, leading to suboptimal trading performance.
- Extreme market risk: In extreme market conditions (such as rapid and substantial changes), the Fisher Transform indicator may fail, causing the strategy to make incorrect trading decisions.
Optimization Direction
- Parameter optimization: Optimize key parameters such as the Fisher Transform period and dynamic threshold calculation method to improve the strategy's adaptability to different market states.
- Signal filtering: In addition to trend recognition, introduce other technical indicators or market sentiment indicators to confirm trading signals and improve signal reliability.
- Stop-loss and take-profit: Set reasonable stop-loss and take-profit rules to control single-trade risk and improve the strategy's risk-reward ratio.
- Position management: Dynamically adjust position sizes based on factors such as market trend strength and price volatility to reduce holding risk.
Summary
The Fisher Transform Dynamic Threshold Trend Following Strategy identifies changes in price trends using the Fisher Transform indicator and dynamic thresholds, adapting to different market states. The strategy effectively captures market trends and enables trend-following trading. Its advantages include dynamic threshold adjustment, reduced price noise interference, and intuitive chart display. However, it also faces challenges such as parameter optimization risk, trend recognition lag, poor performance in choppy markets, and extreme market risk. Through measures like parameter optimization, signal filtering, stop-loss and take-profit, and position management, the strategy's robustness and profitability can be further enhanced.
- 1