Trend Following Adaptive Expected Value Assessment Strategy Based on Crossover Moving Averages

Overview
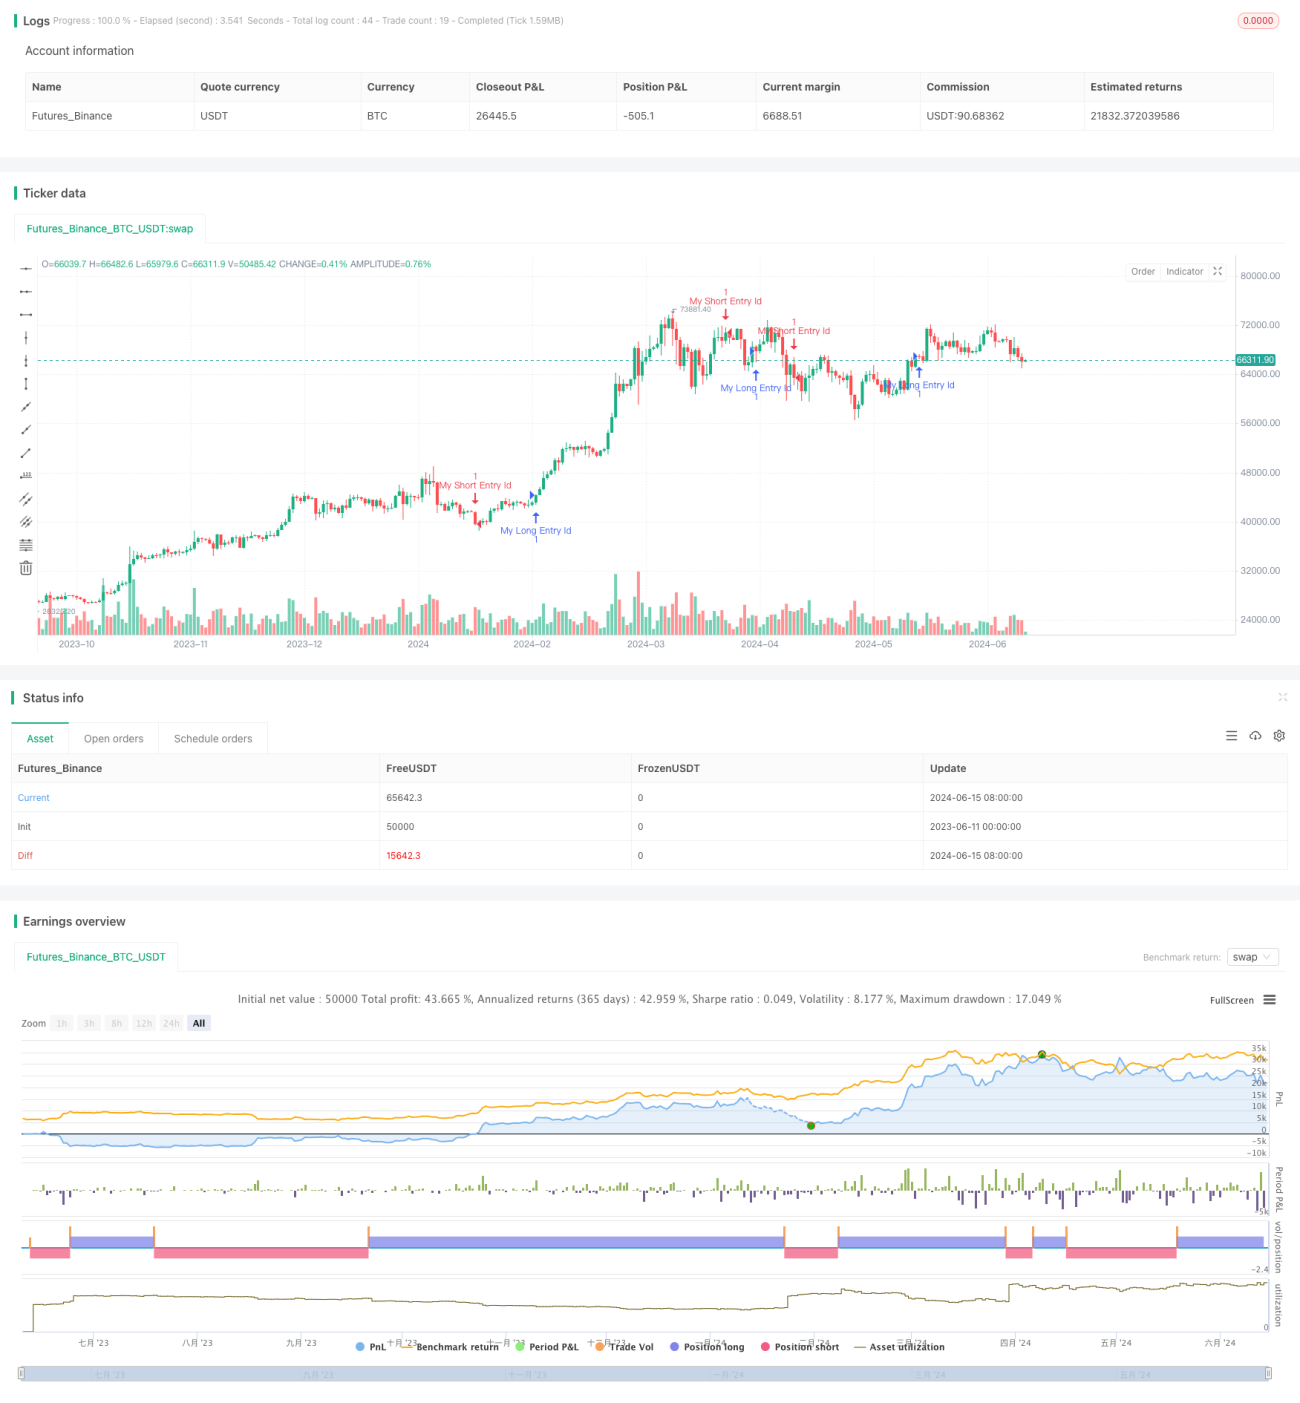
This strategy uses the crossover of two simple moving averages with different periods to determine the trend direction and enters trades when a trend appears. At the same time, the strategy also introduces an expected value panel to calculate and display the expected returns of the strategy at different time scales, allowing users to better assess the strategy's performance. The expected value panel takes into account key indicators such as the strategy's win rate, average profit, and average loss during historical periods, and presents the strategy's performance under different market conditions in an intuitive manner.
Strategy Principle
The core of this strategy is to use the crossover of two simple moving averages with different periods (14-day and 28-day in this example) to determine market trends. When the short-term average crosses above the long-term average from below, it is considered that the market has entered an upward trend, and the strategy opens a long position. Conversely, when the short-term average crosses below the long-term average from above, it is considered that the market has entered a downward trend, and the strategy opens a short position. In this way, the strategy can adapt to different market trends and establish positions in a timely manner when trends appear to capture the profits brought by the trends.
In addition to the basic trend determination and trading logic, the strategy also introduces an expected value panel to calculate and display the expected returns of the strategy at different time scales (monthly and yearly). The calculation of expected value is based on key statistical indicators of the strategy during historical periods, including:
- Win rate: the proportion of profitable trades to total trades in the time period
- Average profit: the average profit amount of all profitable trades in the time period
- Average loss: the average loss amount of all losing trades in the time period
Using these indicators, the expected value of the strategy in that time period can be calculated:
Expected Value = Win Rate × Average Profit - (1 - Win Rate) × Average Loss
By displaying the expected values of different time periods in the form of a heatmap on the chart, users can see at a glance the expected performance of the strategy under different market conditions, thus better grasping the applicability and risk of the strategy.
Advantage Analysis
-
Strong adaptability to trends: By using moving average crossovers to determine trends, the strategy can adjust positions in a timely manner under different market trends to adapt to market changes. This enables the strategy to achieve good returns in trending markets.
-
Intuitive performance evaluation: The built-in expected value panel displays the expected returns of the strategy at different time periods in the form of a heatmap, allowing users to assess the performance of the strategy under different market conditions at a glance. This visualized performance presentation provides users with more decision-making references.
-
Consideration of key statistical indicators: The calculation of expected value not only considers the win rate of the strategy but also integrates the impact of average profit and average loss. This calculation method can reflect the actual performance of the strategy more comprehensively and accurately, providing users with more reliable references.
-
Flexible parameter settings: Users can flexibly set whether to display the expected value panel and its transparency according to their needs. This allows users to adjust the display effect of the chart according to their preferences, improving the user experience.
Risk Analysis
-
Poor performance in range-bound markets: Since the strategy mainly relies on trends to generate profits, frequent trading in range-bound or trend-unclear market conditions may lead to significant slippage and transaction costs, affecting the overall performance of the strategy.
-
Limitations of expected value calculation: Although the expected value panel provides an intuitive way to evaluate strategy performance, it is still based on historical data for calculation. When significant changes occur in the market or extreme situations arise, historical data may not well reflect the actual performance of the strategy, and the reference value of expected value may be reduced.
-
Large impact of parameter selection: The performance of the strategy largely depends on the selection of moving average periods. Different period combinations may bring completely different trading results. If the selected parameters cannot well adapt to market characteristics, the actual performance of the strategy may deviate significantly from the expected value.
Optimization Direction
-
Introduce more technical indicators: On the basis of the existing moving averages, other technical indicators such as MACD and RSI can be considered to better determine the strength and sustainability of trends, thereby improving the timing of strategy entries and exits.
-
Optimize position management: Currently, the strategy adopts a fixed position approach when trading signals appear. It can be considered to dynamically adjust positions based on factors such as market volatility and trend strength to better control risks and increase returns.
-
Add stop-profit and stop-loss mechanisms: Adding reasonable stop-profit and stop-loss mechanisms to the strategy can help the strategy lock in existing profits in a timely manner while limiting potential losses. This helps to improve the risk-reward ratio of the strategy and maintain relatively steady performance in various market environments.
-
Optimize the calculation of expected value: The calculation method of expected value can be further optimized, such as considering transaction costs and introducing moving windows to improve the effectiveness and practicality of the expected value indicator. In addition, other strategy performance evaluation indicators can be explored to provide users with more comprehensive references.
Summary
This strategy determines market trends by using moving average crossovers and establishes positions in a timely manner when trends appear to capture the profits brought by the trends. At the same time, the strategy also introduces an intuitive expected value panel to display the expected returns of the strategy at different time scales, providing users with more decision-making references. Although the strategy may perform poorly in range-bound markets and the calculation of expected value has certain limitations, by introducing more technical indicators, optimizing position management, adding stop-profit and stop-loss mechanisms, and other measures, the risk-reward ratio of the strategy can be further improved, enabling it to better adapt to changing market environments.
- 1