概述
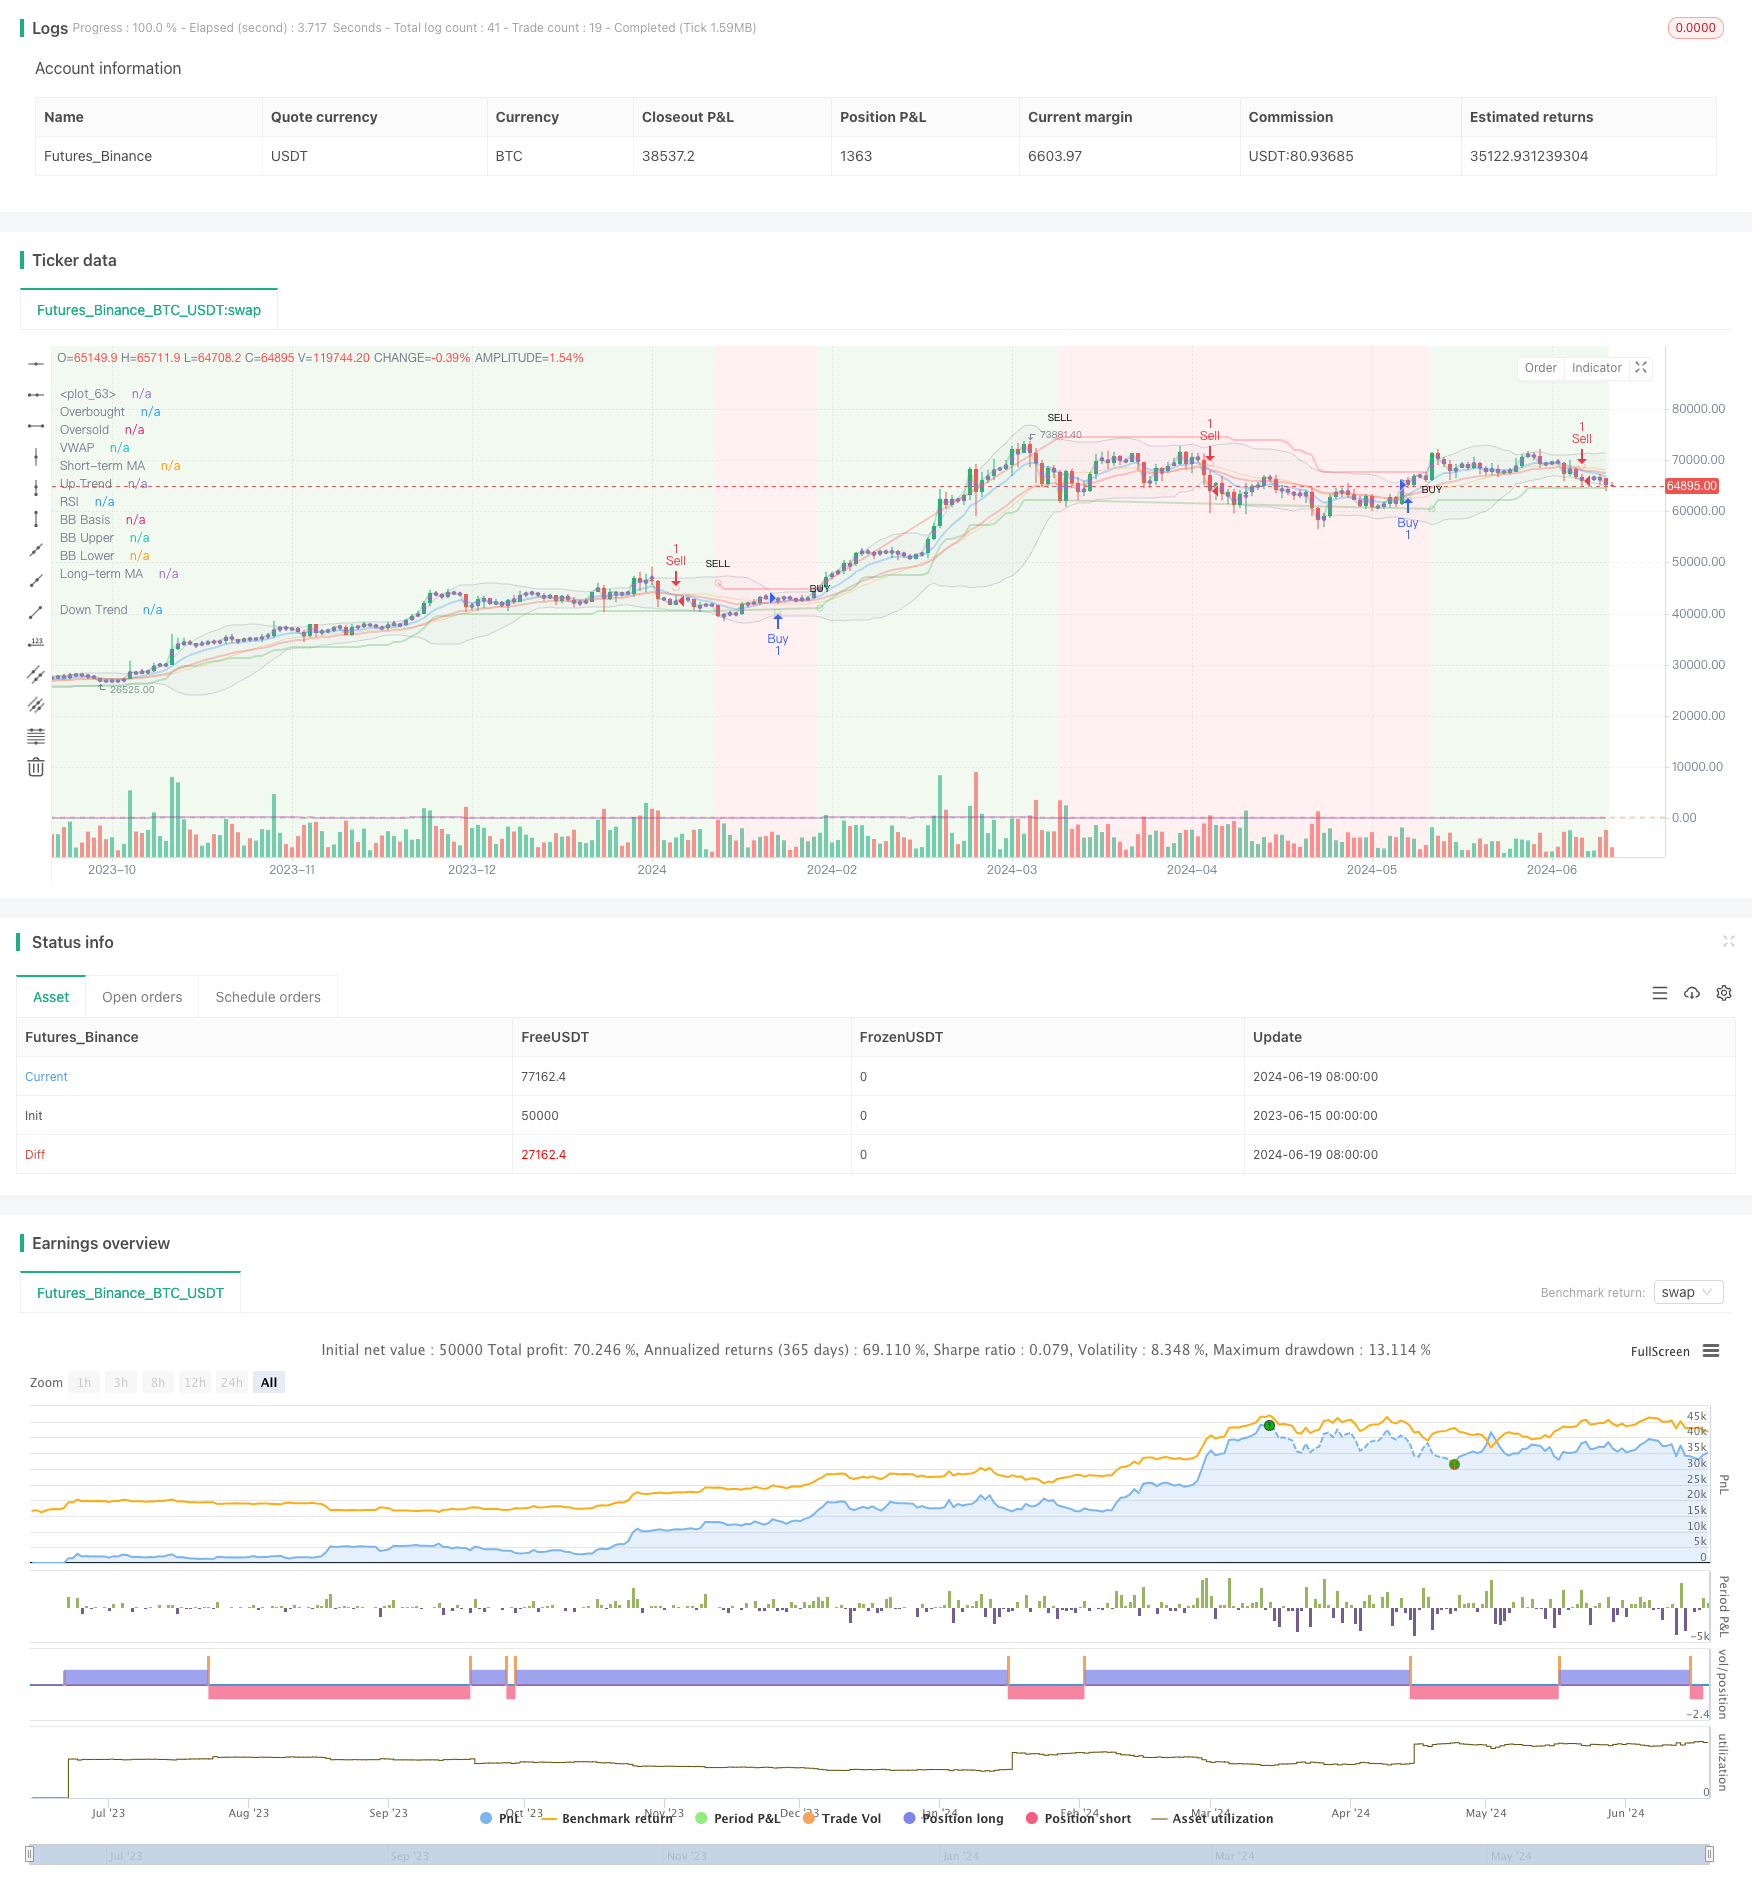
本策略是一个综合性的技术分析交易系统,结合了多个常用的技术指标来生成买卖信号。该策略主要利用移动平均线(MA)、相对强弱指数(RSI)、布林带(Bollinger Bands)、Supertrend指标以及成交量加权平均价格(VWAP)等指标,通过这些指标的交叉和突破来判断市场趋势并做出交易决策。策略的核心思想是通过多个指标的综合分析来提高交易信号的可靠性,同时利用趋势跟踪的方法来捕捉市场的主要走势。
策略原理
移动平均线(MA):策略使用了两条指数移动平均线(EMA),分别是短期(9周期)和长期(21周期)。当短期均线上穿长期均线时,视为买入信号;反之,当短期均线下穿长期均线时,视为卖出信号。
相对强弱指数(RSI):策略使用14周期的RSI指标。虽然代码中没有直接使用RSI生成交易信号,但RSI可以用来判断市场是否处于超买或超卖状态,为其他指标提供辅助参考。
布林带(Bollinger Bands):策略使用20周期的布林带,带宽为2倍标准差。布林带可以用来判断价格波动的范围,当价格触及或突破上下轨时,可能预示着趋势的反转。
Supertrend指标:这是一个趋势跟踪指标,基于ATR(平均真实范围)计算。当Supertrend线从价格下方转到上方时,生成买入信号;当从上方转到下方时,生成卖出信号。
成交量加权平均价格(VWAP):VWAP被绘制在图表上,可以用来判断当前价格相对于日内平均水平的位置,为交易决策提供额外的参考。
背景颜色:策略根据Supertrend指标的趋势方向改变图表背景颜色,绿色表示上升趋势,红色表示下降趋势,直观地展示了市场的整体趋势。
策略的最终交易信号是基于短期和长期移动平均线的交叉生成的。当短期均线上穿长期均线时,触发买入信号;当短期均线下穿长期均线时,触发卖出信号。这种方法旨在捕捉趋势的起始阶段,同时其他指标可以用来确认信号的有效性。
策略优势
多指标综合分析:通过结合多个技术指标,策略能够从不同角度分析市场,提高信号的可靠性和准确性。这种方法可以减少单一指标可能带来的假信号。
趋势跟踪:策略的核心是跟随市场趋势,这有助于捕捉大的市场走势,提高盈利机会。
可视化效果:策略在图表上绘制了多个指标和信号,包括背景颜色的变化,这使得交易者可以直观地理解市场状态和潜在的交易机会。
灵活性:策略提供了多个可调参数,允许交易者根据不同的市场条件和个人偏好进行优化。
全面的市场分析:通过综合考虑价格趋势(移动平均线)、波动性(布林带)、动量(RSI)和成交量(VWAP),策略能够提供全面的市场分析。
自动化交易:策略可以在TradingView平台上实现自动化交易,减少了人为情绪的影响,提高了交易的客观性和纪律性。
策略风险
过度优化:由于策略包含多个指标和参数,存在过度优化的风险。过度优化可能导致策略在历史数据上表现良好,但在实际交易中效果不佳。
信号滞后:移动平均线和其他技术指标通常具有滞后性,可能导致在趋势转折点附近产生较大的回撤。
频繁交易:在震荡市场中,移动平均线可能会频繁交叉,导致过多的交易信号和高额的交易成本。
市场条件变化:策略可能在特定市场条件下表现良好,但在市场环境发生变化时效果可能会显著下降。
指标冲突:多个指标可能会在某些时候产生相互矛盾的信号,这可能会导致交易决策的困难和不确定性。
缺乏风险管理:代码中没有明确的止损和止盈设置,这可能会导致在不利行情中承受过大的损失。
策略优化方向
引入动态参数:可以考虑根据市场波动性动态调整移动平均线和布林带的参数,以适应不同的市场环境。
增加过滤条件:可以添加额外的过滤条件,例如交易量确认或趋势强度指标,以减少假信号和提高交易质量。
实现止损和止盈:在策略中加入适当的止损和止盈机制,以控制风险和锁定利润。
优化入场时机:可以考虑结合RSI和布林带的信号来优化入场时机,例如在RSI超买/超卖区域且价格接近布林带边界时入场。
加入市场regime识别:实现对不同市场状态(趋势、震荡)的识别,并在不同状态下采用不同的交易策略。
改进Supertrend指标的使用:可以考虑将Supertrend指标作为主要的趋势判断工具,而不仅仅用于背景颜色的变化。
加入情绪指标:引入基于成交量或波动率的市场情绪指标,以帮助判断市场的整体状态和潜在的转折点。
实现仓位管理:根据信号强度和市场波动性动态调整仓位大小,以优化风险收益比。
总结
“多指标组合趋势跟踪策略”是一个综合性的技术分析交易系统,通过结合多个常用的技术指标来生成交易信号。该策略的核心优势在于其全面的市场分析方法和趋势跟踪能力,能够从多个角度评估市场状况并做出交易决策。然而,策略也面临着过度优化、信号滞后和频繁交易等风险。
为了进一步提高策略的有效性,可以考虑引入动态参数调整、增加过滤条件、实现止损止盈机制、优化入场时机、加入市场regime识别等优化措施。此外,改进Supertrend指标的使用、加入情绪指标和实现有效的仓位管理也是值得探索的方向。
总的来说,这个策略为交易者提供了一个全面的技术分析框架,但在实际应用中需要根据具体的市场条件和个人风险偏好进行适当的调整和优化。通过持续的测试和改进,这个策略有潜力成为一个强大的交易工具,帮助交易者在复杂多变的市场中做出更加明智的决策。
/*backtest
start: 2023-06-15 00:00:00
end: 2024-06-20 00:00:00
period: 1d
basePeriod: 1h
exchanges: [{"eid":"Futures_Binance","currency":"BTC_USDT"}]
*/

//@version=5
strategy("Comb Backtest Debug", overlay=true)

// Input Parameters
lengthMA1 = input.int(9, title="Short-term MA Length")
lengthMA2 = input.int(21, title="Long-term MA Length")
lengthRSI = input.int(14, title="RSI Length")
lengthBB = input.int(20, title="Bollinger Bands Length")
multBB = input.float(2.0, title="Bollinger Bands Multiplier")
lengthSupertrend = input.int(3, title="Supertrend Length")
multSupertrend = input.float(3.0, title="Supertrend Multiplier")
Periods = input.int(10, title="ATR Period")
src = input.source(hl2, title="Source")
Multiplier = input.float(3.0, title="ATR Multiplier", step=0.1)
changeATR = input.bool(true, title="Change ATR Calculation Method?")
highlighting = input.bool(true, title="Highlighter On/Off?")

// Moving Averages
ma1 = ta.ema(close, lengthMA1)
ma2 = ta.ema(close, lengthMA2)

// RSI
rsi = ta.rsi(close, lengthRSI)

// Bollinger Bands
basis = ta.sma(close, lengthBB)
dev = multBB * ta.stdev(close, lengthBB)
upperBB = basis + dev
lowerBB = basis - dev

// ATR Calculation
atr2 = ta.sma(ta.tr, Periods)
atr = changeATR ? ta.atr(Periods) : atr2

// Supertrend Calculation
up = src - (Multiplier * atr)
up1 = nz(up[1], up)
up := close[1] > up1 ? math.max(up, up1) : up

dn = src + (Multiplier * atr)
dn1 = nz(dn[1], dn)
dn := close[1] < dn1 ? math.min(dn, dn1) : dn

trend = 1
trend := nz(trend[1], trend)
trend := trend == -1 and close > dn1 ? 1 : trend == 1 and close < up1 ? -1 : trend

// VWAP
vwap = ta.vwap(close)

// Plotting Supertrend
upPlot = plot(trend == 1 ? up : na, title="Up Trend", style=plot.style_line, linewidth=2, color=color.new(color.green, 70))
dnPlot = plot(trend == 1 ? na : dn, title="Down Trend", style=plot.style_line, linewidth=2, color=color.new(color.red, 70))

// Buy and Sell Signals for Supertrend
buySignal = trend == 1 and trend[1] == -1
sellSignal = trend == -1 and trend[1] == 1

plotshape(buySignal ? up : na, title="UpTrend Begins", location=location.absolute, style=shape.circle, size=size.tiny, color=color.new(color.green, 70), text="BUY", transp=0)
plotshape(sellSignal ? dn : na, title="DownTrend Begins", location=location.absolute, style=shape.circle, size=size.tiny, color=color.new(color.red, 70), text="SELL", transp=0)

// Highlighting the Trend
mPlot = plot(ohlc4, title="", style=plot.style_circles, linewidth=0)
longFillColor = highlighting ? (trend == 1 ? color.new(color.green, 90) : color.white) : color.white
shortFillColor = highlighting ? (trend == -1 ? color.new(color.red, 90) : color.white) : color.white
fill(mPlot, upPlot, title="UpTrend Highlighter", color=longFillColor)
fill(mPlot, dnPlot, title="DownTrend Highlighter", color=shortFillColor)

// Plot Moving Averages
plot(ma1, title="Short-term MA", color=color.new(color.blue, 70), linewidth=2)
plot(ma2, title="Long-term MA", color=color.new(color.red, 70), linewidth=2)

// Plot RSI
hline(70, "Overbought", color=color.new(color.red, 70))
hline(30, "Oversold", color=color.new(color.green, 70))
plot(rsi, title="RSI", color=color.new(color.purple, 70), linewidth=2)

// Plot Bollinger Bands
plot(basis, title="BB Basis", color=color.new(color.orange, 70))
p1 = plot(upperBB, title="BB Upper", color=color.new(color.gray, 70))
p2 = plot(lowerBB, title="BB Lower", color=color.new(color.gray, 70))
fill(p1, p2, color=color.new(color.silver, 90), transp=90)

// Plot VWAP
plot(vwap, title="VWAP", color=color.new(color.green, 70), linewidth=2)

// Background Color Based on Supertrend
bgcolor(trend == 1 ? color.new(color.green, 90) : color.new(color.red, 90), title="Background Color", transp=90)

// Simplified Buy and Sell Conditions for Testing
buyCondition = ta.crossover(ma1, ma2)
sellCondition = ta.crossunder(ma1, ma2)

// Debugging plots
plotchar(buyCondition, char='B', location=location.belowbar, color=color.new(color.green, 70), size=size.small, title="Buy Condition")
plotchar(sellCondition, char='S', location=location.abovebar, color=color.new(color.red, 70), size=size.small, title="Sell Condition")

// Strategy orders for backtesting
if (buyCondition)
    strategy.entry("Buy", strategy.long)

if (sellCondition)
    strategy.entry("Sell", strategy.short)

// Alerts for Combined Buy and Sell Conditions
alertcondition(buyCondition, title="Combined Buy Alert", message="Combined Buy Signal")
alertcondition(sellCondition, title="Combined Sell Alert", message="Combined Sell Signal")
alertcondition(buySignal, title="SuperTrend Buy", message="SuperTrend Buy!")
alertcondition(sellSignal, title="SuperTrend Sell", message="SuperTrend Sell!")
changeCond = trend != trend[1]
alertcondition(changeCond, title="SuperTrend Direction Change", message="SuperTrend has changed direction!")