资源加载中... loading...

Adaptive Risk Management Strategy Based on Dual Moving Average Golden Cross

Author: ChaoZhang, Date: 2024-09-26 16:17:20
Tags: SMAMA

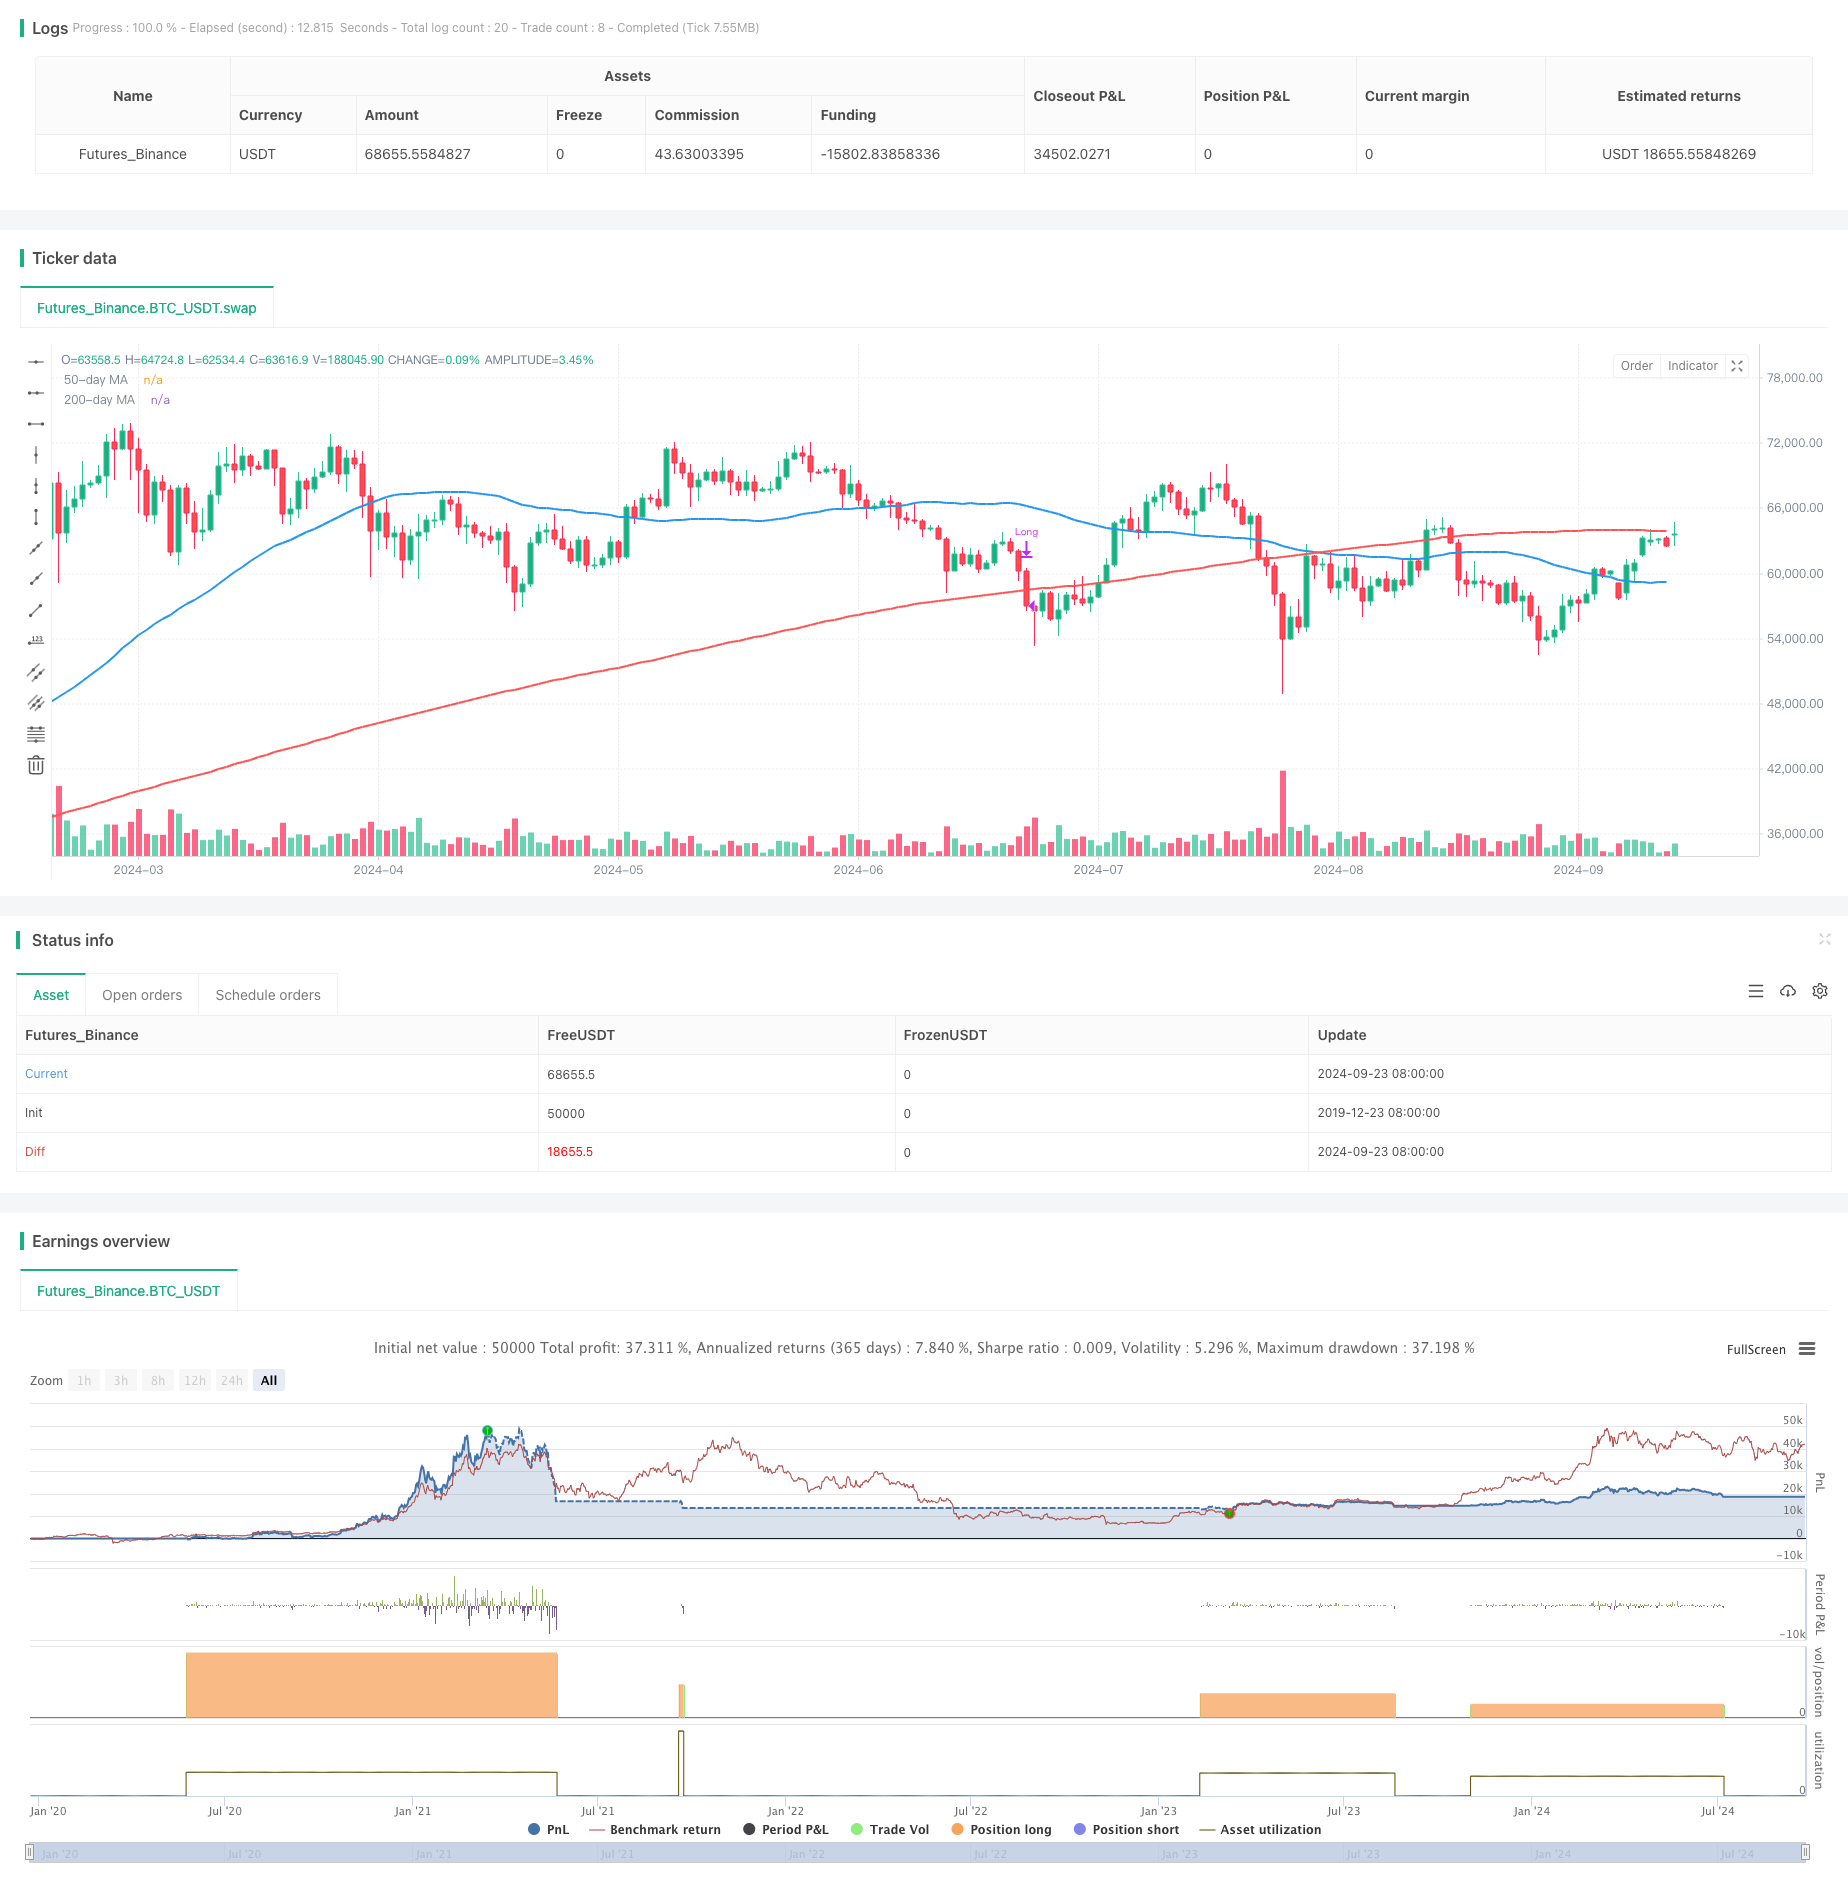
img

Overview

This is a trading strategy based on the golden cross of dual moving averages, combined with adaptive risk management and dynamic position sizing. The strategy uses 50-day and 200-day Simple Moving Averages (SMA) to identify trends, generating a buy signal when the 50-day MA crosses above the 200-day MA. Simultaneously, the strategy employs a risk control method based on 2.5% of the total account equity, dynamically calculating the position size for each trade, and uses a percentage-based stop-loss relative to the 200-day MA to protect profits.

Strategy Principles

  1. Entry Signal: A buy signal is triggered when the 50-day MA crosses above the 200-day MA (Golden Cross).
  2. Risk Management: Each trade risks no more than 2.5% of the total account equity.
  3. Position Sizing: The position size for each trade is dynamically calculated based on the risk amount and stop-loss distance.
  4. Stop-Loss Setting: The stop-loss price is set 1.5% below the 200-day MA.
  5. Exit Condition: The trade is closed when the price falls below the 200-day MA.

Strategy Advantages

  1. Trend Following: Utilizes the golden cross to capture strong upward trends, increasing profit opportunities.
  2. Risk Control: Employs percentage-based risk management, effectively controlling the risk exposure for each trade.
  3. Dynamic Positioning: Automatically adjusts position size based on market volatility, balancing risk and reward.
  4. Flexible Stop-Loss: Uses a relative stop-loss that automatically adjusts with market fluctuations, protecting profits while allowing sufficient price movement.
  5. Clear Exit: Sets a clear exit condition, avoiding indecision caused by subjective judgment.

Strategy Risks

  1. False Breakouts: May trigger frequent false signals in choppy markets, leading to consecutive small losses.
  2. Lag: Moving averages are inherently lagging indicators, potentially missing significant early trend movements.
  3. Large Gaps: A large downward gap may result in actual losses exceeding the preset 2.5% risk limit.
  4. Overtrading: In range-bound markets, frequent MA crossovers may increase unnecessary trading costs.
  5. Single Technical Indicator: Relying solely on moving averages may ignore other important market information.

Strategy Optimization Directions

  1. Introduce Filtering Mechanisms: Consider adding volume, volatility, or other indicators to filter for more reliable trading signals.
  2. Optimize Entry Timing: Incorporate other technical indicators (e.g., RSI, MACD) to confirm trends and reduce false breakouts.
  3. Dynamic Parameter Adjustment: Automatically adjust MA periods based on different market cycles to improve strategy adaptability.
  4. Add Take-Profit Mechanism: Set dynamic take-profit conditions to lock in more profits during strong market movements.
  5. Risk Diversification: Consider applying the strategy across multiple uncorrelated markets to reduce systemic risk.

Summary

This adaptive risk management strategy based on the dual moving average golden cross combines classic technical analysis methods with modern risk management techniques, providing traders with a relatively robust trading system. It not only captures medium to long-term trends but also effectively controls risk, suitable for investors seeking stable returns. However, when using this strategy, traders still need to closely monitor market changes and continuously optimize parameters based on actual trading performance to achieve the best risk-reward ratio.


/*backtest
start: 2019-12-23 08:00:00
end: 2024-09-24 08:00:00
period: 1d
basePeriod: 1d
exchanges: [{"eid":"Futures_Binance","currency":"BTC_USDT"}]
*/

//@version=5
strategy("Golden Cross with 1.5% Stop-Loss & MA Exit", overlay=true)

// Define the 50-day and 200-day moving averages
ma50 = ta.sma(close, 50)
ma200 = ta.sma(close, 200)

// Entry condition: 50-day MA crosses above 200-day MA (Golden Cross)
goldenCross = ta.crossover(ma50, ma200)

// Exit condition: price drops below the 200-day MA
exitCondition = close < ma200

// Set the stop-loss to 1.5% below the 200-day moving average
stopLoss = ma200 * 0.985  // 1.5% below the 200-day MA

// Risk management (1.5% of total equity)
riskPercent = 0.025  // 1.5% risk
equity = strategy.equity
riskAmount = equity * riskPercent

// Calculate the distance between the entry price (close) and the stop-loss
stopDistance = close - stopLoss

// Calculate position size based on the risk amount and stop-loss distance
if (goldenCross and stopDistance > 0)
    positionSize = riskAmount / stopDistance
    strategy.entry("Long", strategy.long, qty=positionSize)

// Exit the trade when the price crosses below the 200-day moving average
if (exitCondition)
    strategy.close("Long")

// Plot the moving averages on the chart for visualization
plot(ma50, color=color.blue, linewidth=2, title="50-day MA")
plot(ma200, color=color.red, linewidth=2, title="200-day MA")

template: strategy.tpl:40:21: executing "strategy.tpl" at <.api.GetStrategyListByName>: wrong number of args for GetStrategyListByName: want 7 got 6