MACD Dynamic Oscillation Cross-Prediction Strategy

Overview
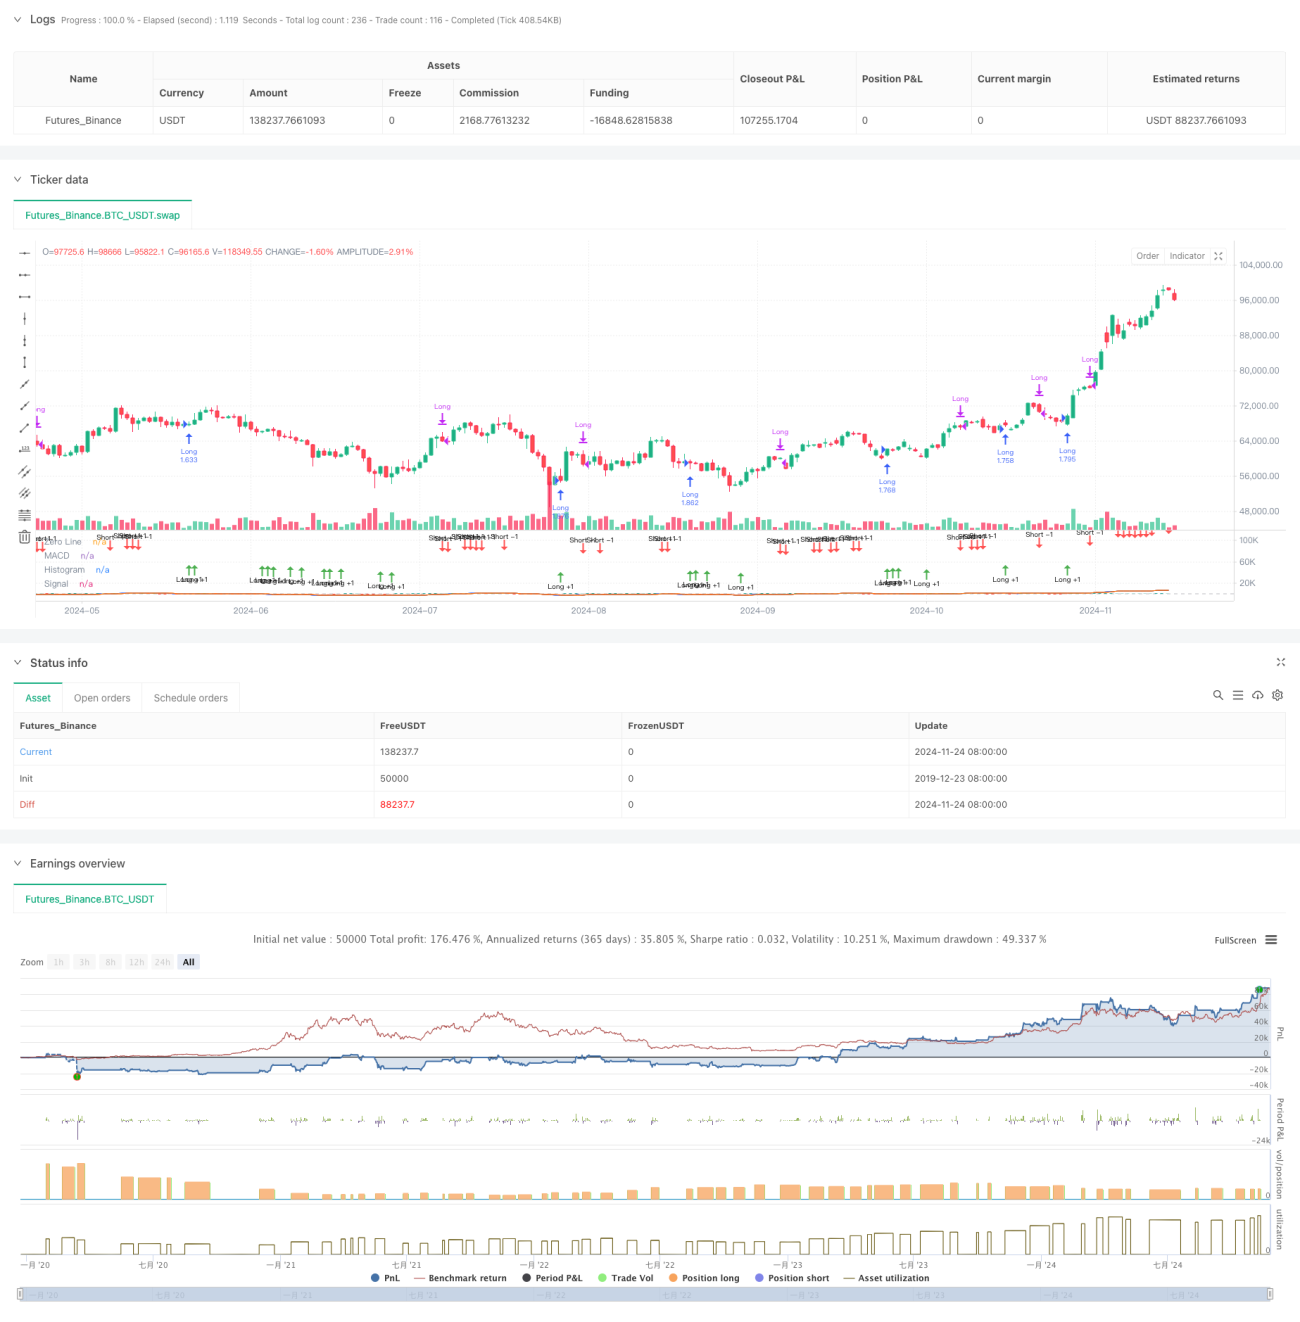
This strategy bases trading decisions on the dynamic characteristics of the MACD (Moving Average Convergence Divergence) indicator. The core approach focuses on observing changes in the MACD histogram to predict potential golden and death crosses, allowing for early position establishment. The strategy goes beyond traditional MACD crossover signals by emphasizing the dynamic characteristics of the histogram to obtain better entry timing.
Strategy Principles
The strategy employs a modified MACD indicator system, incorporating the difference between fast (EMA12) and slow (EMA26) moving averages, along with a 2-period signal line. The core trading logic is based on several key points:
- Calculating histogram rate of change (hist_change) to judge trend dynamics
- Anticipating golden cross signals by entering long positions when the histogram is negative and shows an upward trend for three consecutive periods
- Anticipating death cross signals by closing positions when the histogram is positive and shows a downward trend for three consecutive periods
- Implementing a time filtering mechanism to trade only within specified time ranges
Strategy Advantages
- Strong Signal Prediction: Anticipates potential crossover signals by observing histogram dynamics, improving entry timing
- Reasonable Risk Control: Incorporates 0.1% commission and 3-point slippage, reflecting realistic trading conditions
- Flexible Capital Management: Uses percentage-based position sizing relative to account equity for effective risk control
- Excellent Visualization: Uses color-coded histograms and arrow markers for trade signals, facilitating analysis
Strategy Risks
- False Breakout Risk: Frequent false signals may occur in ranging markets
- Lag Risk: Despite predictive mechanisms, MACD retains some inherent lag
- Market Environment Dependency: Strategy performs better in trending markets, potentially underperforming in ranging conditions
- Parameter Sensitivity: Strategy performance is highly dependent on fast and slow line period settings
Optimization Directions
- Market Environment Filtering: Add trend identification indicators to adjust trading parameters based on market conditions
- Position Management Enhancement: Implement dynamic position sizing based on signal strength
- Stop Loss Implementation: Add trailing or fixed stop losses to control drawdown
- Signal Confirmation Enhancement: Incorporate additional technical indicators for cross-validation
- Parameter Optimization: Implement adaptive parameters that adjust based on market conditions
Summary
This strategy innovatively utilizes the dynamic characteristics of the MACD histogram to improve upon traditional MACD trading systems. The predictive mechanism provides earlier entry signals, while strict trading conditions and risk control measures ensure strategy stability. With further optimization and refinement, this strategy shows promise for improved performance in actual trading conditions.
/*backtest
start: 2019-12-23 08:00:00
end: 2024-11-25 08:00:00
period: 1d
basePeriod: 1d
exchanges: [{"eid":"Futures_Binance","currency":"BTC_USDT"}]
*/

//@version=5
strategy(title="Demo GPT - Moving Average Convergence Divergence", shorttitle="MACD", commission_type=strategy.commission.percent, commission_value=0.1, slippage=3, default_qty_type=strategy.percent_of_equity, default_qty_value=100)

// Getting inputs- 1