概述
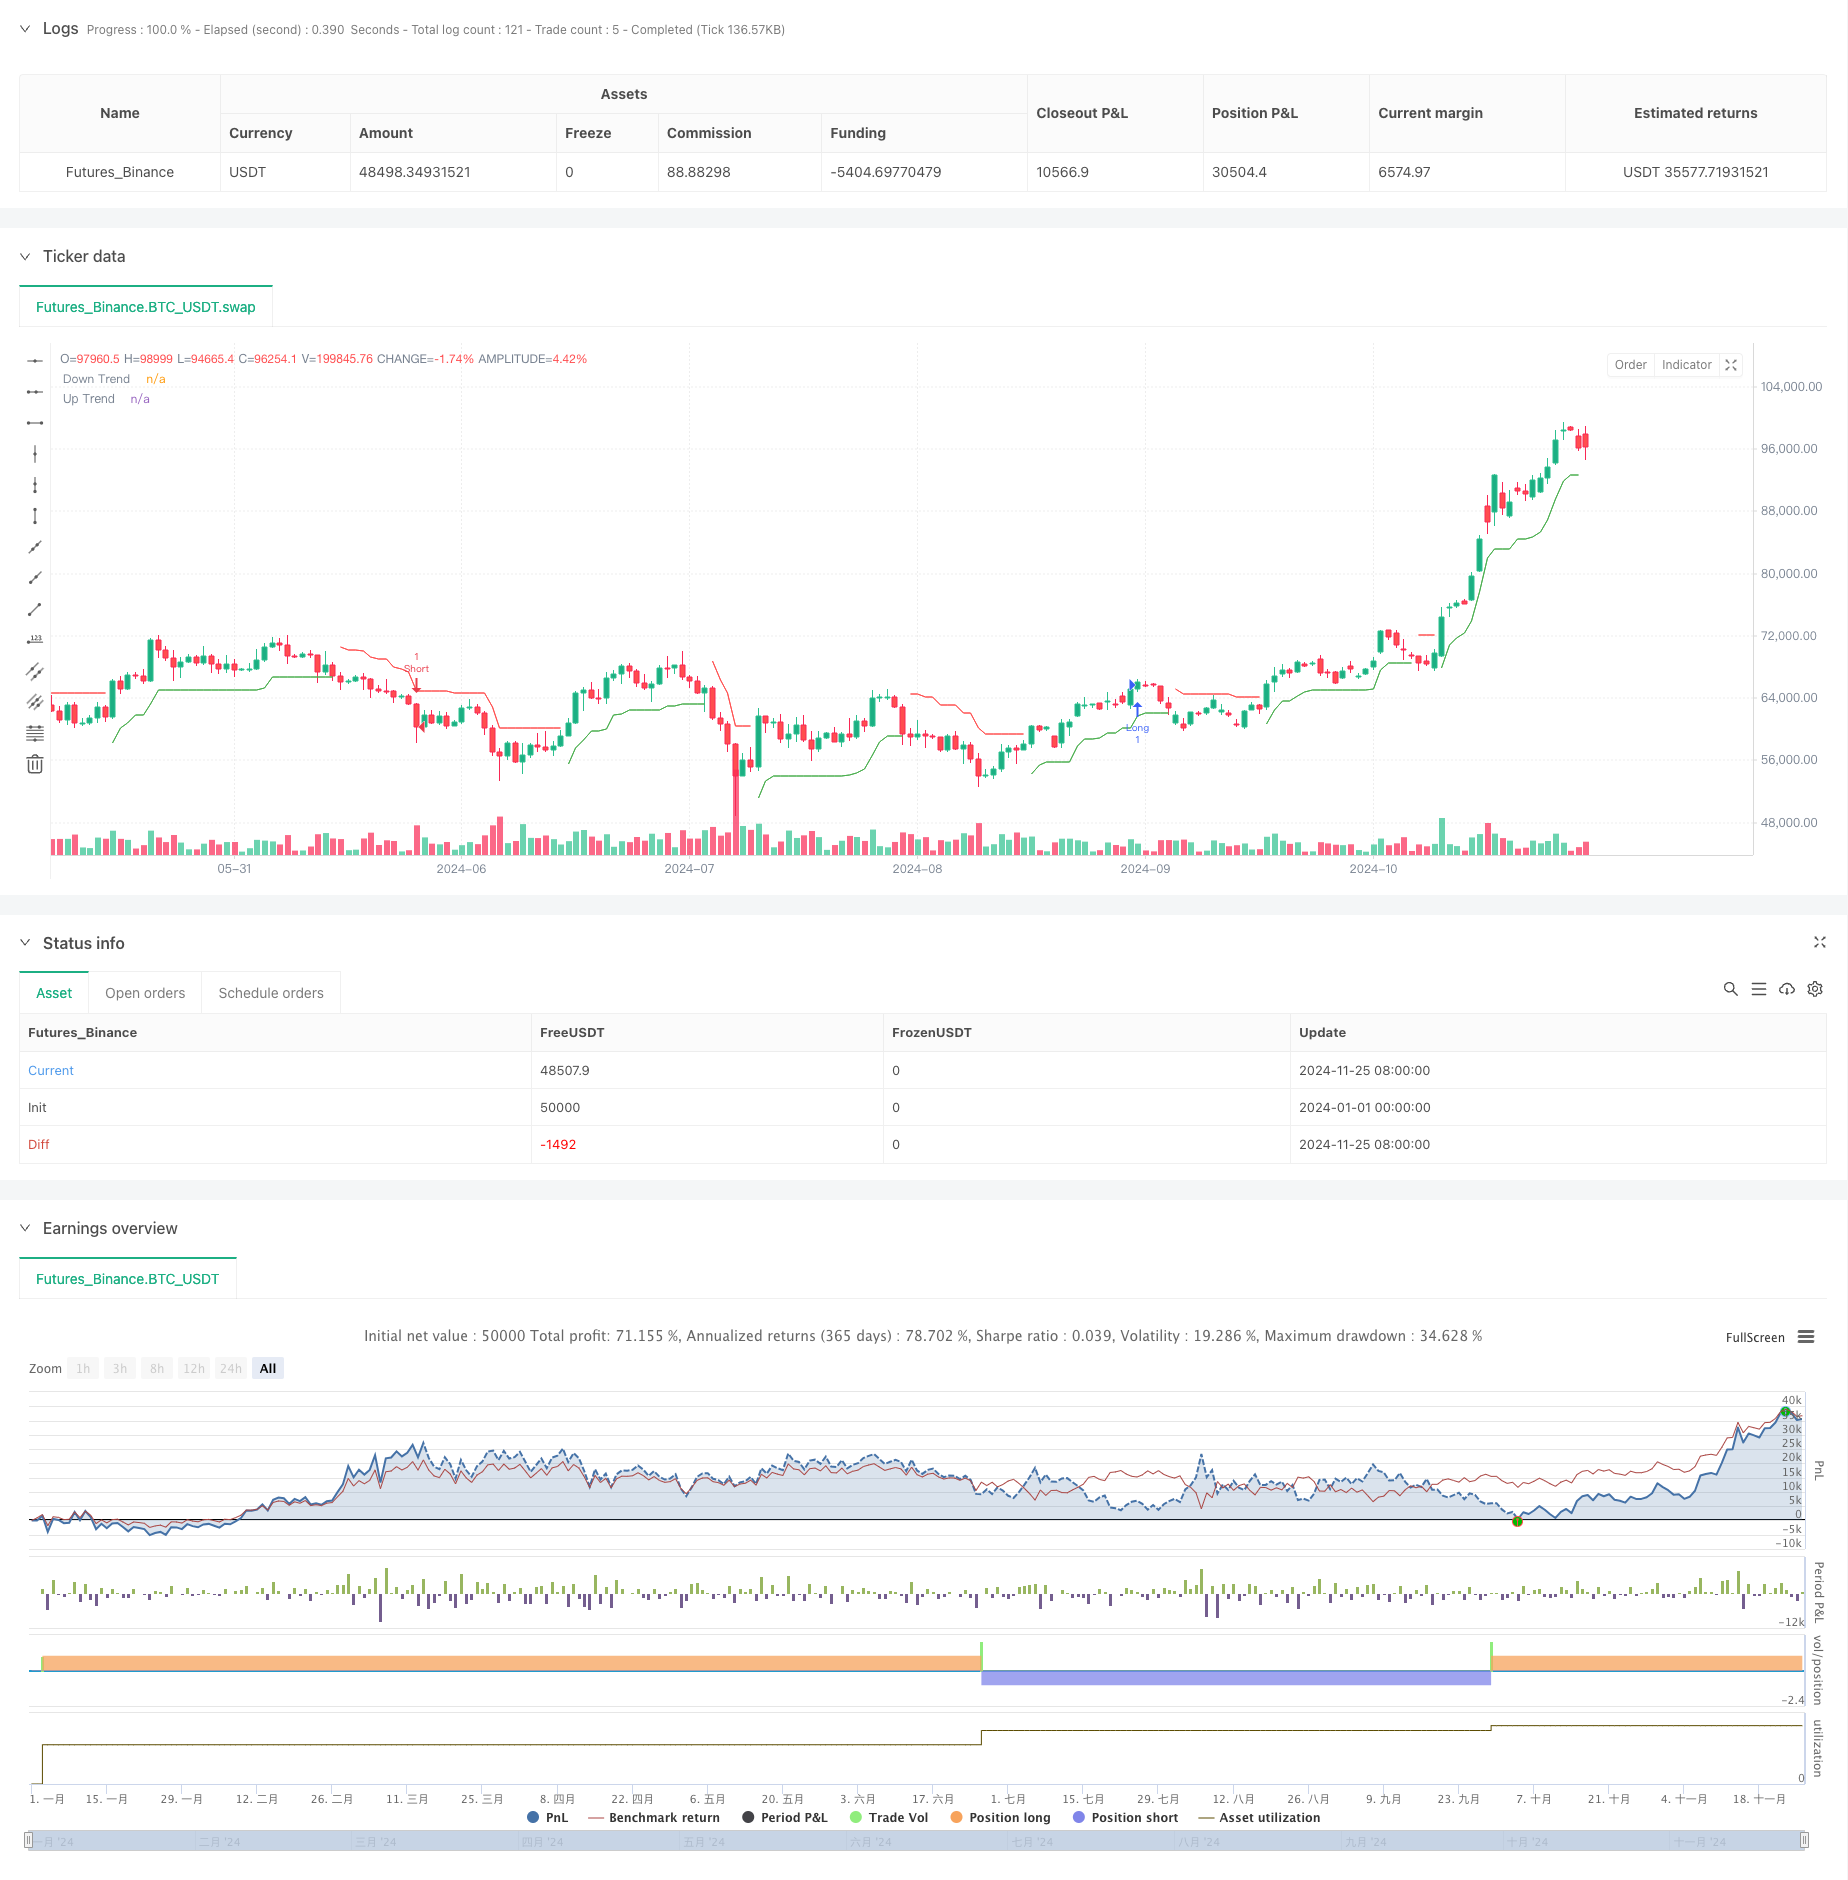
本策略是一个结合了Z分数(Z-Score)统计方法、相对强弱指标(RSI)和超级趋势(Supertrend)指标的量化交易系统。策略通过监控价格的统计偏离度,结合动量指标和趋势确认,在市场中寻找高概率的交易机会。该策略不仅能够捕捉市场的超买超卖机会,还能通过趋势确认来过滤虚假信号,实现多空双向交易。
策略原理
策略的核心逻辑建立在三个主要技术指标的协同作用上:首先,通过计算价格的Z分数来衡量当前价格相对于历史均值的偏离程度,其中使用了75周期的移动平均线和标准差。当Z分数超过1.1或低于-1.1时,表明价格出现了显著的统计偏离。其次,引入RSI指标作为动量确认,要求在开仓时RSI需要配合方向(多头时RSI>60,空头时RSI<40)。最后,使用超级趋势指标作为趋势过滤器,该指标基于11周期的ATR和2.0的乘数因子计算。只有当这三个条件同时满足时,策略才会发出交易信号。
策略优势
- 多重信号确认:通过结合统计、动量和趋势三个维度的指标,大大提高了交易信号的可靠性。
- 适应性强:Z分数的计算方法使策略能够适应不同的市场环境,而不受绝对价格水平的影响。
- 风险控制完善:超级趋势指标提供了自动的趋势跟踪和风险控制机制。
- 双向交易:策略能够在多空两个方向上捕捉机会,提高了资金利用效率。
- 信号清晰:策略使用明确的数学模型和客观的指标,避免了主观判断。
策略风险
- 滞后性风险:由于使用了多个周期的移动平均线,策略在快速变化的市场中可能出现信号滞后。
- 假突破风险:在横盘市场中,可能会出现频繁的假突破信号。
- 参数敏感性:策略的效果高度依赖于参数的选择,不同市场环境可能需要不同的参数设置。
- 市场条件依赖:在趋势不明显的市场中,策略的表现可能不够理想。
策略优化方向
- 动态参数调整:可以引入自适应参数机制,根据市场波动率自动调整Z分数阈值和超级趋势的参数。
- 增加市场环境过滤:加入市场环境识别模块,在不同的市场条件下使用不同的参数组合。
- 完善止损机制:引入动态止损策略,如基于ATR的止损或者跟踪止损。
- 优化信号过滤:可以添加成交量确认或其他技术指标来进一步过滤交易信号。
- 引入时间过滤:考虑增加交易时间窗口的限制,避开波动较大的时段。
总结
这是一个综合了统计学方法和技术分析的量化交易策略,通过多重信号确认来提高交易的可靠性。策略的核心优势在于其客观的数学模型和完善的风险控制机制,但同时也需要注意参数优化和市场适应性的问题。通过建议的优化方向,策略还有进一步提升的空间,特别是在动态适应市场环境和风险控制方面。该策略适合在波动性较大且具有明显趋势的市场中使用,对于追求稳健收益的量化交易者来说是一个值得考虑的选择。
策略源码
/*backtest
start: 2024-01-01 00:00:00
end: 2024-11-26 00:00:00
period: 1d
basePeriod: 1d
exchanges: [{"eid":"Futures_Binance","currency":"BTC_USDT"}]
*/

//@version=5
strategy("Z-Score Long and Short Strategy with Supertrend", overlay=true)

// Inputs for Z-Score
len = input.int(75, "Z-Score Lookback Length")
z_long_threshold = 1.1  // Threshold for Z-Score to open long
z_short_threshold = -1.1  // Threshold for Z-Score to open short

// Z-Score Calculation
z = (close - ta.sma(close, len)) / ta.stdev(close, len)

// Calculate Driver RSI
driver_rsi_length = input.int(14, "Driver RSI Length")  // Input for RSI Length
driver_rsi = ta.rsi(close, driver_rsi_length)  // Calculate the RSI

// Supertrend Parameters
atrPeriod = input.int(11, "ATR Length", minval=1)
factor = input.float(2.0, "Factor", minval=0.01, step=0.01)

// Supertrend Calculation
[supertrend, direction] = ta.supertrend(factor, atrPeriod)

// Conditions for Long and Short based on Z-Score
z_exceeds_long = z >= z_long_threshold and driver_rsi > 60
z_exceeds_short = z <= z_short_threshold and driver_rsi < 40

// Entry Conditions
if (z_exceeds_long and direction < 0) // Enter Long if Z-Score exceeds threshold and Supertrend is down
    strategy.entry("Long", strategy.long)
    label.new(bar_index, low, text="Open Long", style=label.style_label_up, color=color.green, textcolor=color.white, size=size.small)
    alert("Open Long", alert.freq_once_per_bar)  // Alert for Long entry

if (z_exceeds_short and direction > 0) // Enter Short if Z-Score exceeds threshold and Supertrend is up
    strategy.entry("Short", strategy.short)
    label.new(bar_index, high, text="Open Short", style=label.style_label_down, color=color.red, textcolor=color.white, size=size.small)
    alert("Open Short", alert.freq_once_per_bar)  // Alert for Short entry

// Plot Supertrend
upTrend = plot(direction < 0 ? supertrend : na, "Up Trend", color=color.green, style=plot.style_linebr)
downTrend = plot(direction > 0 ? supertrend : na, "Down Trend", color=color.red, style=plot.style_linebr)
fill(upTrend, downTrend, color=color.new(color.green, 90), fillgaps=false)

// Alert conditions for Supertrend changes (optional)
alertcondition(direction[1] > direction, title='Downtrend to Uptrend', message='The Supertrend value switched from Downtrend to Uptrend')
alertcondition(direction[1] < direction, title='Uptrend to Downtrend', message='The Supertrend value switched from Uptrend to Downtrend')
相关推荐