
Overview
This strategy is a quantitative trading system that combines Bollinger Bands, Relative Strength Index (RSI), and Dynamic Cost Averaging (DCA). The strategy implements automatic position building through established money management rules during market fluctuations, while integrating technical indicators for buy/sell signal determination to achieve controlled risk execution. The system also includes take-profit logic and cumulative profit tracking functionality for effective monitoring and management of trading performance.
Strategy Principles
The strategy operates based on the following core components:
- Bollinger Bands for determining price volatility ranges, considering buying at lower band and selling at upper band
- RSI for confirming overbought/oversold conditions, confirming oversold below 25 and overbought above 75
- DCA module dynamically calculates position sizes based on account equity for adaptive capital management
- Take-profit module sets 5% profit target for automatic position closing
- Market state monitoring calculates 90-day market changes to assess overall trends
- Cumulative profit tracking records each trade's profit/loss for strategy performance evaluation
Strategy Advantages
- Multiple technical indicator cross-validation improves signal reliability
- Dynamic position management avoids fixed-position risks
- Reasonable take-profit conditions secure timely profits
- Market trend monitoring capabilities aid in big-picture understanding
- Comprehensive profit tracking system facilitates strategy analysis
- Well-configured alert system provides real-time trading opportunities
Strategy Risks
- Choppy markets may trigger frequent signals increasing trading costs
- RSI indicators may lag in trending markets
- Fixed percentage take-profit may exit too early in strong trends
- DCA strategy may cause significant drawdowns in prolonged downtrends
Risk management recommendations:
- Set maximum position limits
- Dynamically adjust parameters based on market volatility
- Add trend filters
- Implement tiered take-profit strategy
Strategy Optimization Directions
- Parameter Dynamic Optimization:
- Bollinger Bands parameters adapt to volatility
- RSI thresholds vary with market cycles
- DCA allocation adjusts with account size
- Signal System Enhancement:
- Add volume confirmation
- Include trendline analysis
- Integrate additional technical indicator cross-validation
- Risk Control Improvement:
- Implement dynamic stop-loss
- Add maximum drawdown control
- Set daily loss limits
Summary
The strategy builds a comprehensive trading system through combined technical analysis and money management methods. Its strengths lie in multiple signal confirmation and thorough risk management, though it still requires extensive testing and optimization in live trading. Through continuous improvement in parameter settings and additional auxiliary indicators, the strategy shows promise for stable performance in actual trading.
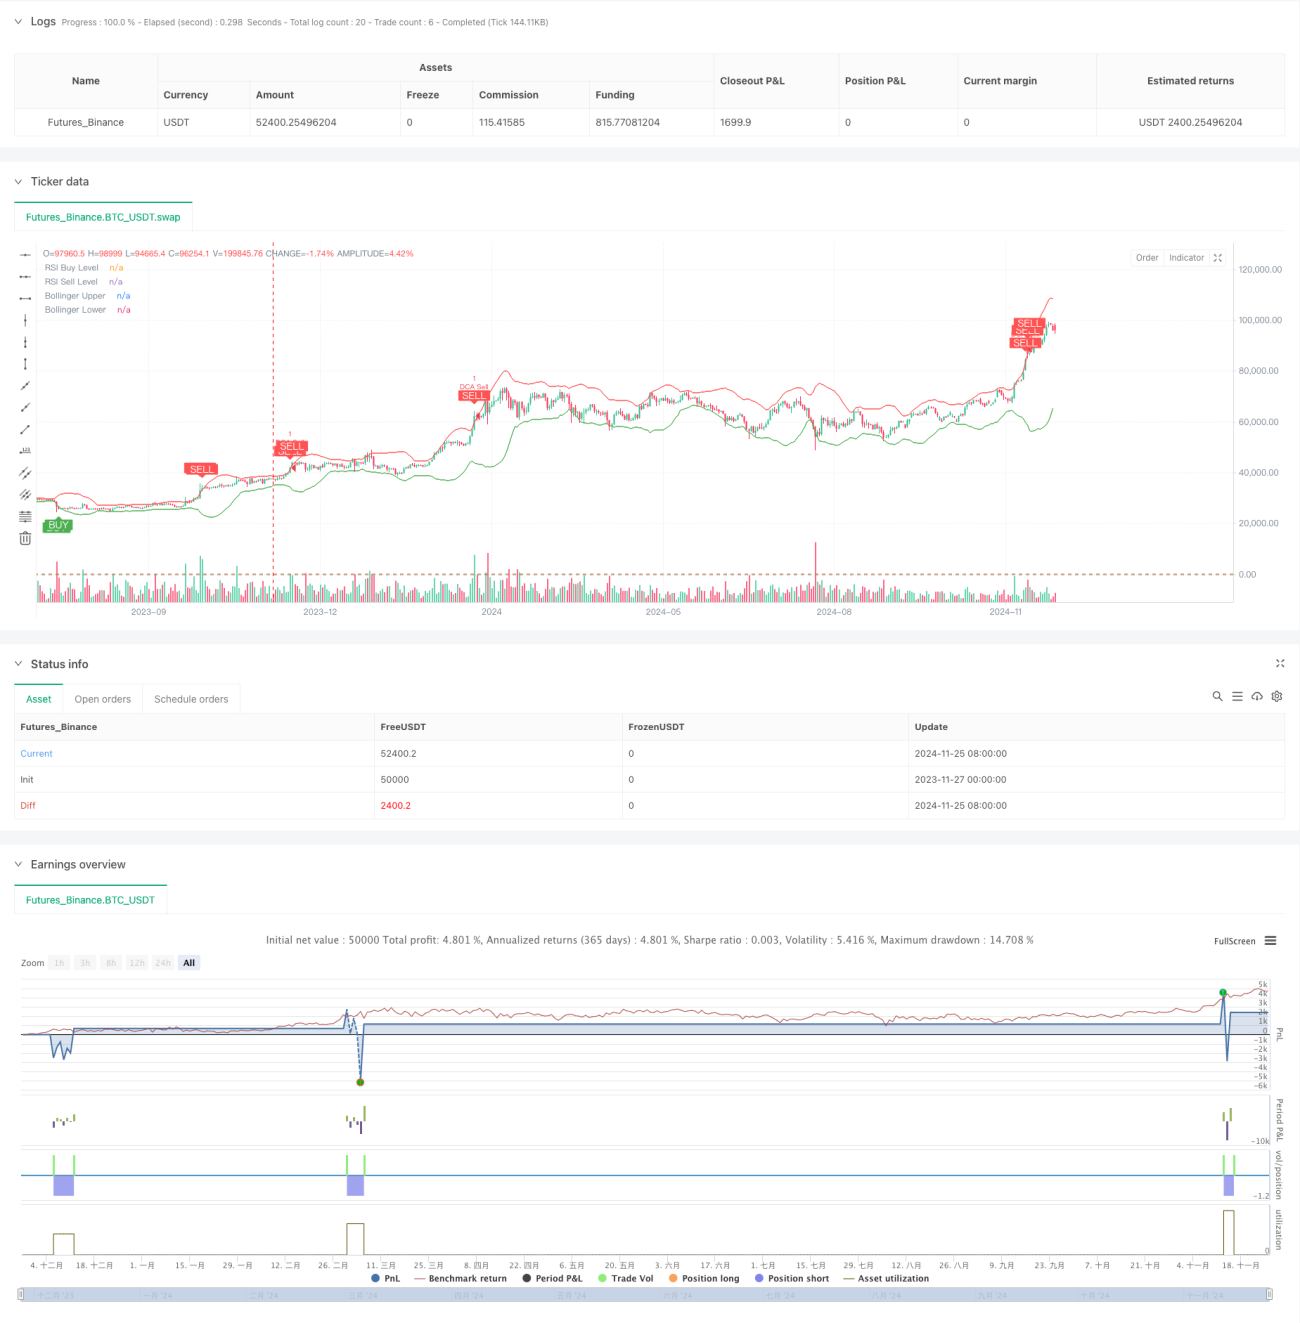
/*backtest
start: 2023-11-27 00:00:00
end: 2024-11-26 00:00:00
period: 1d
basePeriod: 1d
exchanges: [{"eid":"Futures_Binance","currency":"BTC_USDT"}]
*/

//@version=5
strategy("Combined BB RSI with Cumulative Profit, Market Change, and Futures Strategy (DCA)", shorttitle="BB RSI Combined DCA Strategy", overlay=true)

// Input Parameters- 1