概述
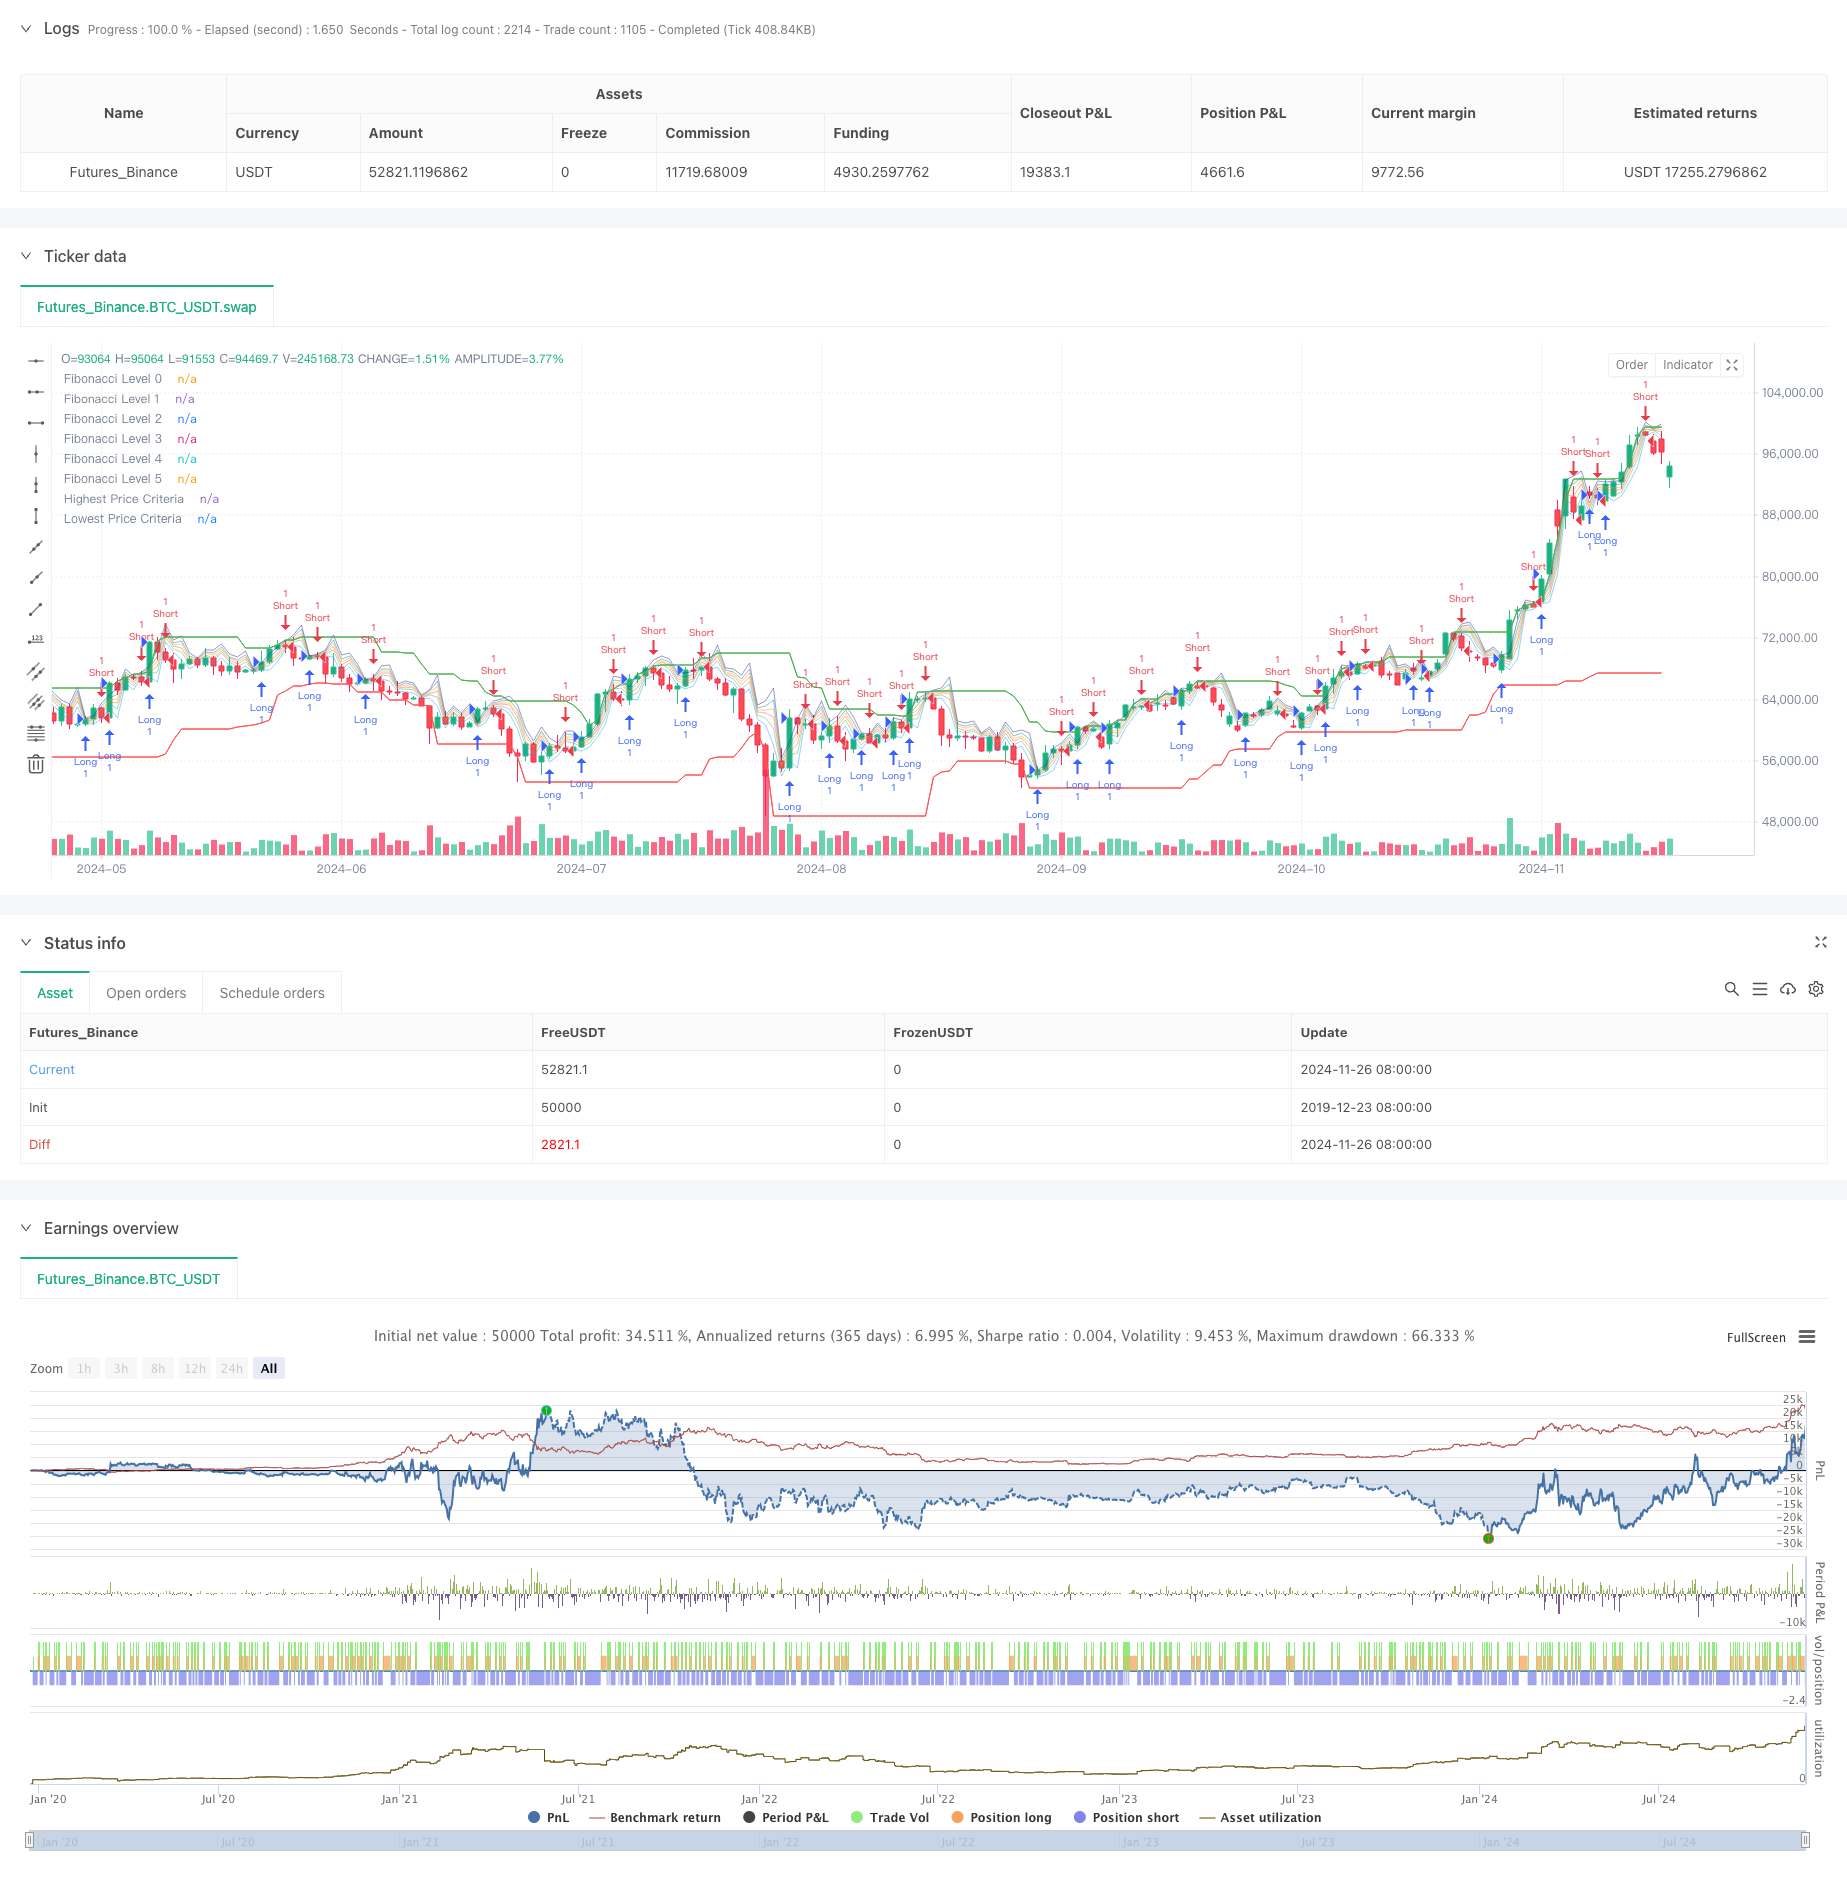
该策略是一个结合了多重技术分析工具的高级交易系统,主要基于高时间框架的Fibonacci回撤水平与价格高低点突破条件来生成交易信号。策略通过动态计算更高时间框架的价格数据,结合Fibonacci回撤水平和自定义的价格突破条件,形成一个完整的交易决策系统。这种方法既考虑了市场的整体趋势,又关注短期价格突破,能够在市场转折点捕捉潜在的交易机会。
策略原理
策略的核心逻辑建立在三个主要支柱之上:首先是更高时间框架的价格分析,通过计算日线等较高时间周期的开高低收价格,建立更宏观的市场视角。其次是Fibonacci回撤水平的动态计算,基于高时间框架的价格区间设定关键的支撑阻力位。最后是价格突破判定,通过设定回溯期间的最高价和最低价作为突破参考。买入信号在价格突破最近低点且越过50%Fibonacci回撤位时触发,而卖出信号则在价格跌破最近高点且跌破50%Fibonacci回撤位时产生。
策略优势
- 多维度分析:结合了技术分析中最受认可的几个要素,包括价格行为、趋势跟踪和支撑阻力。
- 适应性强:可以根据不同市场条件调整参数,包括时间周期、回溯期和Fibonacci水平。
- 风险管理完善:通过多重确认机制降低假突破风险。
- 可视化程度高:所有关键价位都在图表上清晰可见,便于交易决策。
- 灵活性强:可以适用于各种交易品种和时间周期。
策略风险
- 参数敏感性:不同的回溯期设置可能导致信号质量差异较大。
- 市场条件依赖:在震荡市场中可能产生过多假信号。
- 滞后性风险:由于使用了回溯期数据,可能在快速市场中错过最佳入场点。
- 过度优化风险:参数过度优化可能导致未来表现不佳。
策略优化方向
- 增加波动率过滤:建议添加ATR或Bollinger带宽等指标来过滤低波动期。
- 整合趋势过滤:可以加入均线系统来确认整体趋势方向。
- 优化进场时机:可以结合RSI等动量指标改善入场时机。
- 动态参数调整:引入自适应机制,根据市场状况自动调整参数。
- 增强风险控制:加入动态止损和利润目标设置。
总结
这是一个设计精良的交易系统,通过结合多个经典技术分析工具,创造出一个既有理论基础又实用的交易策略。该策略最大的特点是能够通过多维度分析提供更可靠的交易信号,同时保持了足够的灵活性以适应不同市场环境。虽然存在一些固有风险,但通过建议的优化方向,可以进一步提升策略的稳定性和可靠性。对于愿意投入时间进行参数优化和策略改进的交易者来说,这是一个很好的基础框架。
策略源码
/*backtest
start: 2019-12-23 08:00:00
end: 2024-11-27 00:00:00
period: 1d
basePeriod: 1d
exchanges: [{"eid":"Futures_Binance","currency":"BTC_USDT"}]
*/

//@version=5
strategy("Fibonacci Levels Strategy with High/Low Criteria", overlay = true)

// Kullanıcıdan yüksek zaman dilimini ve mum bilgilerini al
timeframe = input.timeframe(defval = "D", title = "Higher Time Frame")
currentlast = input.string(defval = "Last", title = "Current or Last HTF Candle", options = ["Current", "Last"])

// Kullanıcıdan en düşük ve en yüksek fiyat bakış sürelerini al
lowestLookback = input(20, "Lowest Price Lookback", tooltip="The strategy will BUY when the price crosses over the lowest it has been in the last X amount of bars")
highestLookback = input(10, "Highest Price Lookback", tooltip="If Take-Profit is not checked, the strategy will SELL when the price crosses under the highest it has been in the last X amount of bars")

// Fibonacci seviyeleri ayarları
level0 = input.float(defval = 0.000, title = "Level 0")
level1 = input.float(defval = 0.236, title = "Level 1")
level2 = input.float(defval = 0.382, title = "Level 2")
level3 = input.float(defval = 0.500, title = "Level 3")
level4 = input.float(defval = 0.618, title = "Level 4")
level5 = input.float(defval = 0.786, title = "Level 5")
level100 = input.float(defval = 1.000, title = "Level 100")

// HTF mumlarını hesapla
newbar = ta.change(time(timeframe)) != 0
var float htfhigh = high
var float htflow = low
var float htfopen = open
float htfclose = close
var counter = 0

if newbar
    htfhigh := high
    htflow := low
    htfopen := open
    counter := 0
else
    htfhigh := math.max(htfhigh, high)
    htflow := math.min(htflow, low)
    counter += 1

var float open_ = na
var float high_ = na
var float low_ = na
var float close_ = na
if currentlast == "Last" and newbar
    open_ := htfopen[1]
    high_ := htfhigh[1]
    low_ := htflow[1]
    close_ := htfclose[1]
else if currentlast == "Current"
    open_ := htfopen
    high_ := htfhigh
    low_ := htflow
    close_ := htfclose

// Fibonacci seviyelerini hesapla
var float[] fibLevels = array.new_float(6)
array.set(fibLevels, 0, open_ + (high_ - low_) * level0)
array.set(fibLevels, 1, open_ + (high_ - low_) * level1)
array.set(fibLevels, 2, open_ + (high_ - low_) * level2)
array.set(fibLevels, 3, open_ + (high_ - low_) * level3)
array.set(fibLevels, 4, open_ + (high_ - low_) * level4)
array.set(fibLevels, 5, open_ + (high_ - low_) * level5)

// Fibonacci seviyelerini grafik üzerine çiz
plot(array.get(fibLevels, 0), color=color.new(color.blue, 75), title="Fibonacci Level 0")
plot(array.get(fibLevels, 1), color=color.new(color.green, 75), title="Fibonacci Level 1")
plot(array.get(fibLevels, 2), color=color.new(color.red, 75), title="Fibonacci Level 2")
plot(array.get(fibLevels, 3), color=color.new(color.orange, 75), title="Fibonacci Level 3")
plot(array.get(fibLevels, 4), color=color.new(color.teal, 75), title="Fibonacci Level 4")
plot(array.get(fibLevels, 5), color=color.new(color.navy, 75), title="Fibonacci Level 5")

// En düşük ve en yüksek fiyat kriterlerini hesapla
lowcriteria = ta.lowest(low, lowestLookback)[1]
highcriteria = ta.highest(high, highestLookback)[1]

plot(highcriteria, color=color.green, title="Highest Price Criteria")
plot(lowcriteria, color=color.red, title="Lowest Price Criteria")

// Fibonacci seviyeleri ile ticaret sinyalleri oluştur
longCondition = close > lowcriteria and close > array.get(fibLevels, 3) // En düşük kriterin ve Fibonacci seviyesinin üstüne çıkarsa alım
shortCondition = close < highcriteria and close < array.get(fibLevels, 3) // En yüksek kriterin ve Fibonacci seviyesinin altına düşerse satış

if (longCondition)
    strategy.entry("Long", strategy.long)

if (shortCondition)
    strategy.entry("Short", strategy.short)
相关推荐