概述
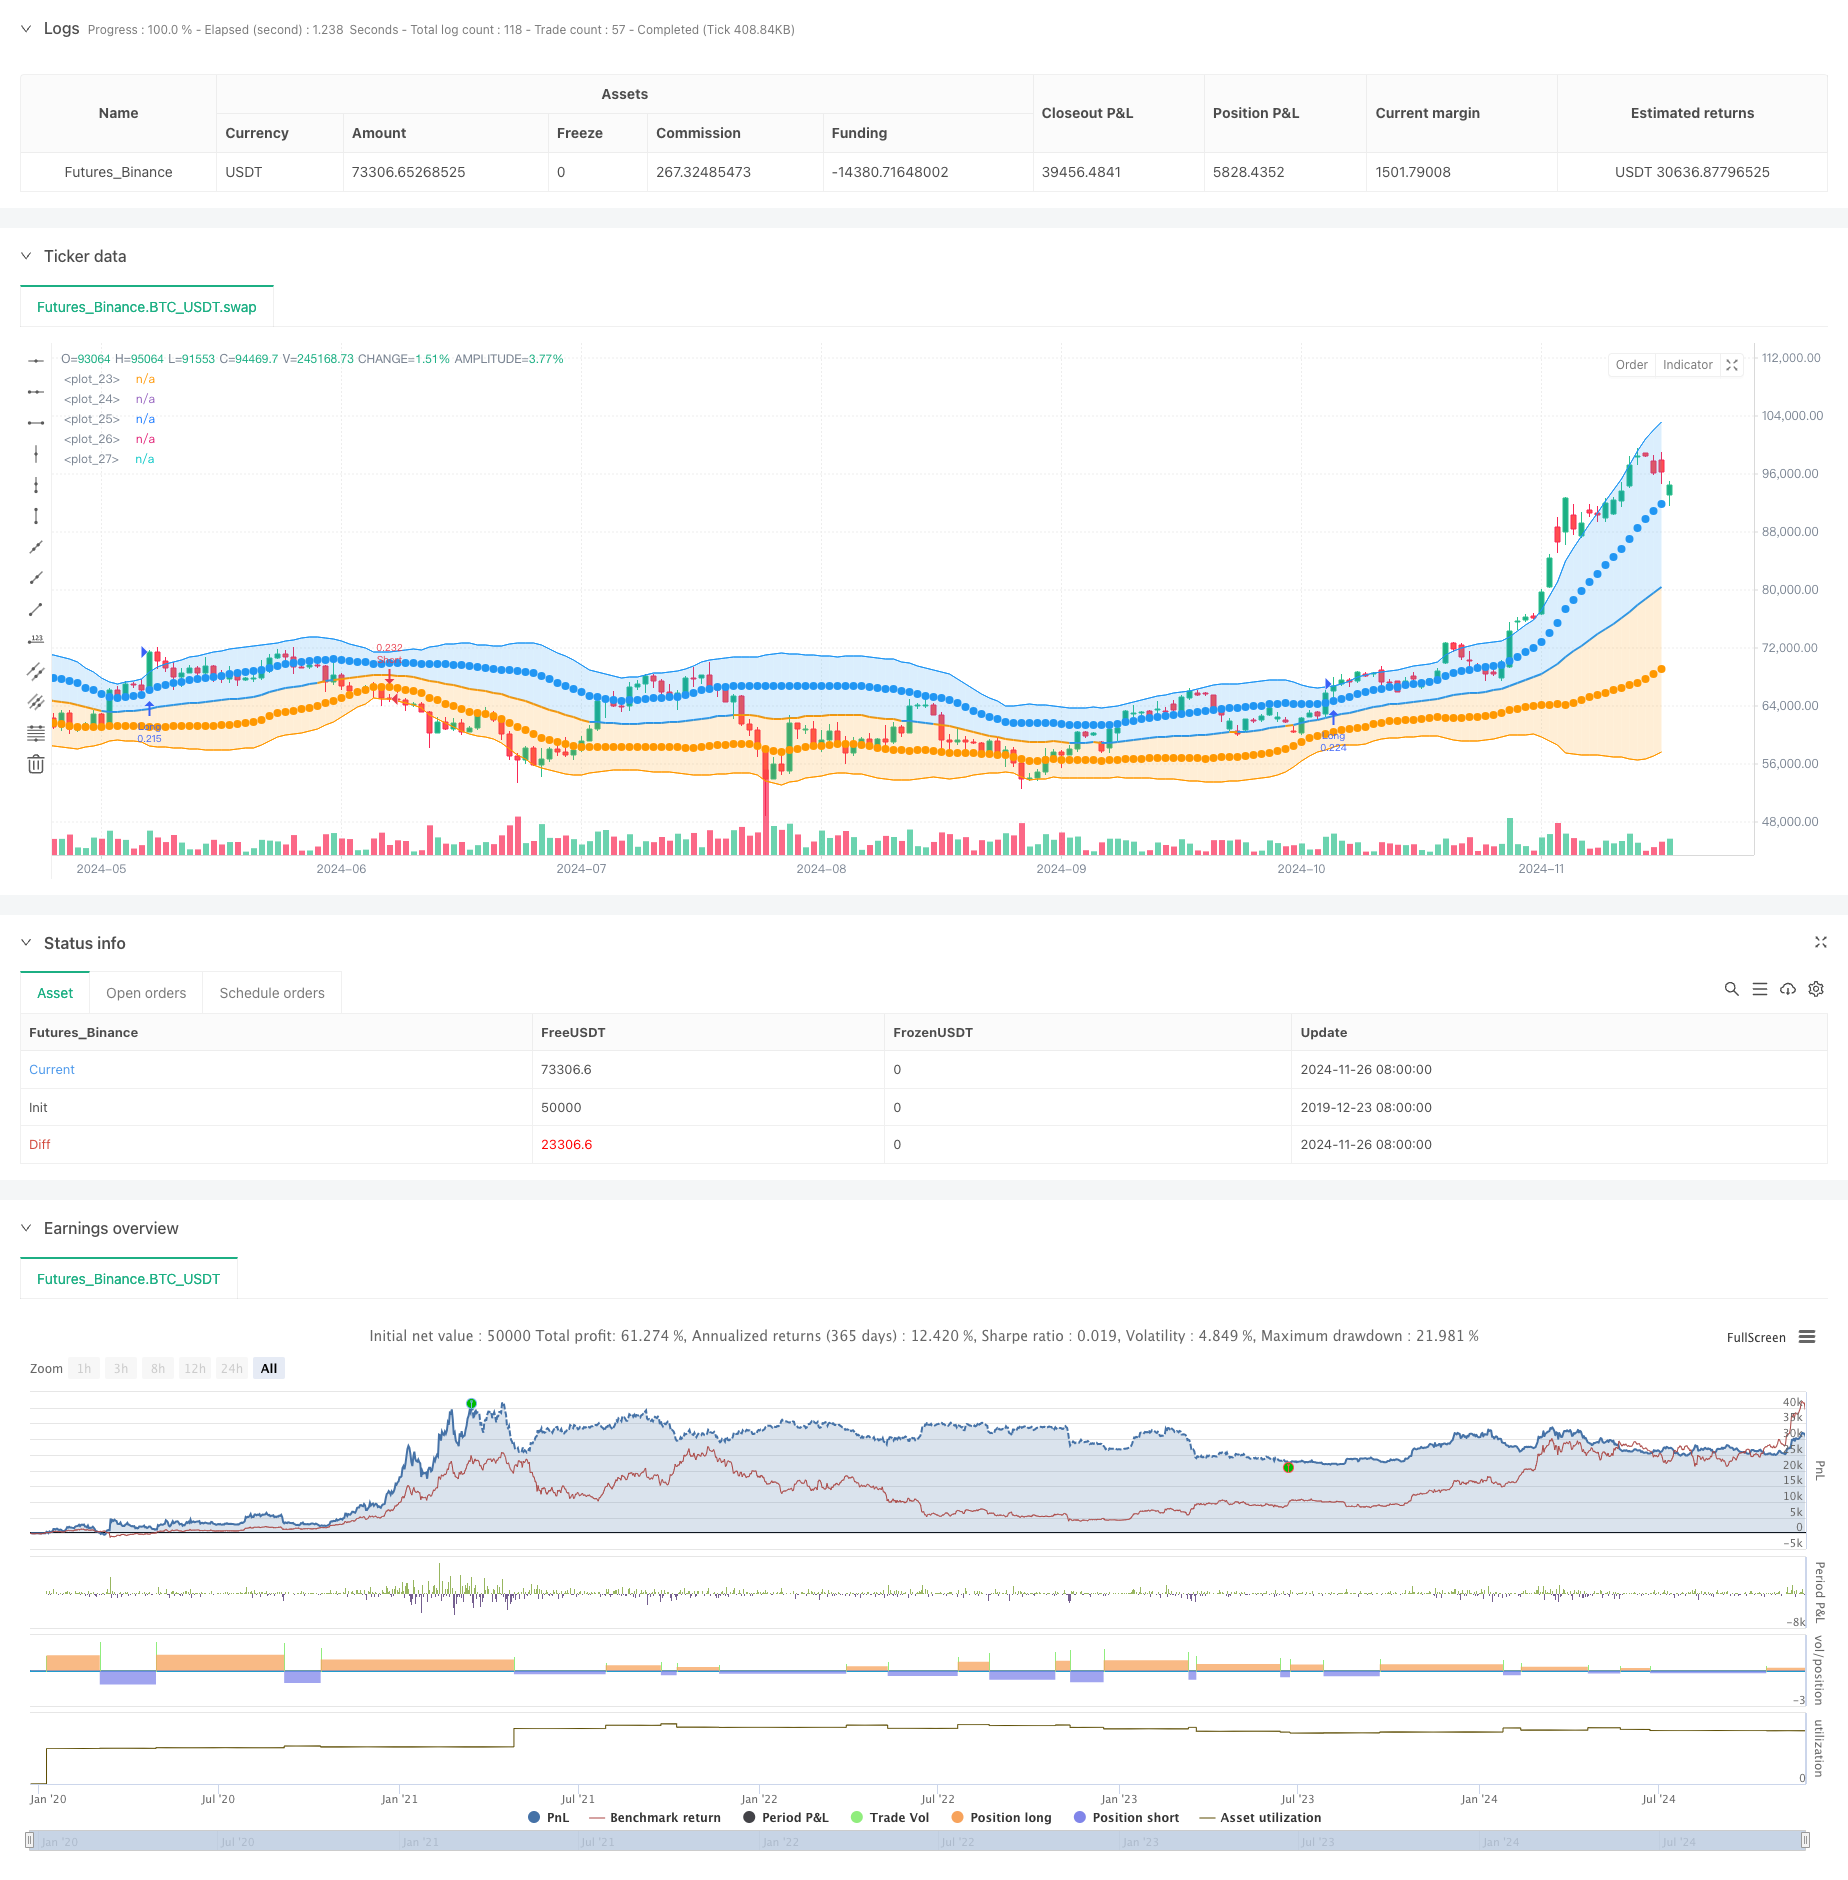
该策略基于布林带指标的创新性应用,通过设置双重标准差带进行市场动量捕捉。策略核心是利用两个不同标准差水平(一倍标准差和两倍标准差)构建的布林带系统,通过价格突破两倍标准差通道时产生交易信号,实现对极端价格波动的把握。该策略通过精确的数学模型和统计学原理,为交易者提供了一个系统化的交易方案。
策略原理
策略采用34周期移动平均线作为中轨,并分别计算一倍和两倍标准差形成上下轨道。当价格突破两倍标准差上轨时,系统发出做多信号;当价格跌破两倍标准差下轨时,系统发出做空信号。同时,策略设置了自动止损机制,当多头持仓时价格跌破下轨或空头持仓时价格突破上轨时,自动平仓。策略使用资金管理系统,默认每次交易使用30%的账户资金,以实现风险的有效控制。
策略优势
- 双重标准差设计提供了更精确的市场极值判断
- 自动化的进出场机制降低了人为判断失误
- 完整的资金管理系统确保风险可控
- 参数可调节性强,适应不同市场环境
- 视觉化程度高,交易信号清晰直观
- 结合了趋势跟踪和波动突破两种交易思路
策略风险
- 在震荡市场中可能产生频繁假突破
- 止损设置可能在高波动市场中导致过早出场
- 固定比例仓位管理在连续亏损时可能加大风险
- 参数设置不当可能导致信号滞后 建议采用以下方法管理风险:
- 结合其他技术指标进行信号确认
- 动态调整标准差倍数
- 引入浮动止损机制
- 根据波动率动态调整仓位
策略优化方向
- 引入自适应标准差计算方法,使布林带宽度能够根据市场波动率自动调整
- 增加成交量确认机制,提高突破信号的可靠性
- 优化资金管理系统,引入动态仓位控制
- 增加趋势过滤器,减少震荡市场中的假信号
- 开发智能参数优化系统,实现策略的自动化调优
总结
这是一个基于经典布林带指标的创新性策略,通过双重标准差的设计,提供了一个兼具理论基础和实用性的交易系统。策略在保持操作简单直观的同时,通过严格的数学模型和完善的风险控制机制,为交易者提供了一个可靠的交易工具。虽然存在一定的优化空间,但其核心逻辑严谨,具有良好的实战价值。
策略源码
/*backtest
start: 2019-12-23 08:00:00
end: 2024-11-27 00:00:00
period: 1d
basePeriod: 1d
exchanges: [{"eid":"Futures_Binance","currency":"BTC_USDT"}]
*/

//@version=5
// Baker Odeh's Strategy - Bollinger Bands : 27/SEP/2014 01:36 : 1.0
// This displays the traditional Bollinger Bands, the difference is
// that the 1st and 2nd StdDev are outlined with two colors and two
// different levels, one for each Standard Deviation

strategy(shorttitle="Baker Odeh's Strategy - Bollinger Bands", title="Baker Odeh's Strategy - Bollinger Bands", overlay=true, currency=currency.NONE, initial_capital=30, default_qty_type=strategy.percent_of_equity, default_qty_value=20)
src = input(close)
length = input.int(34, minval=1)
mult = input.float(2.0, minval=0.001, maxval=50)

basis = ta.sma(src, length)
dev = ta.stdev(src, length)
dev2 = mult * dev

upper1 = basis + dev
lower1 = basis - dev
upper2 = basis + dev2
lower2 = basis - dev2

colorBasis = src >= basis ? color.blue : color.orange

pBasis = plot(basis, linewidth=2, color=colorBasis)
pUpper1 = plot(upper1, color=color.new(color.blue, 0), style=plot.style_circles)
pLower1 = plot(lower1, color=color.new(color.orange, 0), style=plot.style_circles)
pUpper2 = plot(upper2, color=color.new(color.blue, 0))
pLower2 = plot(lower2, color=color.new(color.orange, 0))

fill(pBasis, pUpper2, color=color.new(color.blue, 80))
fill(pUpper1, pUpper2, color=color.new(color.blue, 80))
fill(pBasis, pLower2, color=color.new(color.orange, 80))
fill(pLower1, pLower2, color=color.new(color.orange, 80))

if (close > upper2)
    strategy.entry("Long", strategy.long)

if (close < lower2)
    strategy.entry("Short", strategy.short)

if (close <= lower2)
    strategy.close("Long")

if (close >= upper2)
    strategy.close("Short")
相关推荐