Multi-Timeframe EMA Trend Strategy with Daily High-Low Breakout System

Overview
This is a quantitative trading strategy that combines daily high-low breakouts with multi-timeframe EMA trends. The strategy primarily identifies trading opportunities by monitoring price breakouts of the previous day's high and low levels, combined with EMA trends and the Chaikin Money Flow (CMF) indicator. It utilizes 200-period EMAs on both hourly and daily timeframes to enhance trading accuracy through multiple technical indicator validation.
Strategy Principles
The core logic includes the following key elements:
- Uses request.security function to obtain previous day's high and low prices as key support and resistance levels.
- Incorporates 24-period EMA as the baseline for trend determination.
- Implements CMF (20-period) as a comprehensive indicator of volume and price to assess market money flow.
- Calculates 200 EMAs on both current and 1-hour timeframes to determine larger trend directions.
Specific trading rules:
Long Entry: Price breaks above previous day's high + Close above EMA + Positive CMF
Short Entry: Price breaks below previous day's low + Close below EMA + Negative CMF
Exit: Cross below EMA for longs, cross above EMA for shorts
Strategy Advantages
- Multiple technical indicator validation improves trading reliability
- Multi-timeframe analysis provides comprehensive trend assessment
- CMF indicator integration better captures market money flow conditions
- Previous day's high-low levels align with market participants' trading habits
- Clear strategy logic that's easy to understand and execute
- Well-defined entry and exit conditions minimize subjective judgment
Strategy Risks
- May generate frequent false signals in ranging markets
- Not sufficiently responsive to instantaneous price breakouts
- Potential missed opportunities at key levels
- Lacks consideration of larger timeframe trends
- May experience significant drawdowns during extreme market volatility
Risk Control Suggestions:
- Implement appropriate stop-loss levels
- Adjust parameters based on market conditions
- Add trend filters
- Consider incorporating volatility indicators
Optimization Directions
- Implement adaptive parameter optimization mechanisms
- Add more market condition filters
- Optimize stop-loss and take-profit mechanisms
- Include volatility indicators for different market conditions
- Consider position management mechanisms
- Add volume analysis indicators
Summary
This is a complete trading system combining multiple technical indicators and multi-timeframe analysis. The strategy seeks trading opportunities through comprehensive analysis of intraday high-low breakouts, moving average trends, and money flow. While certain risks exist, the strategy holds good practical value through proper risk control and continuous optimization. Traders are advised to conduct thorough backtesting and parameter optimization before live implementation.
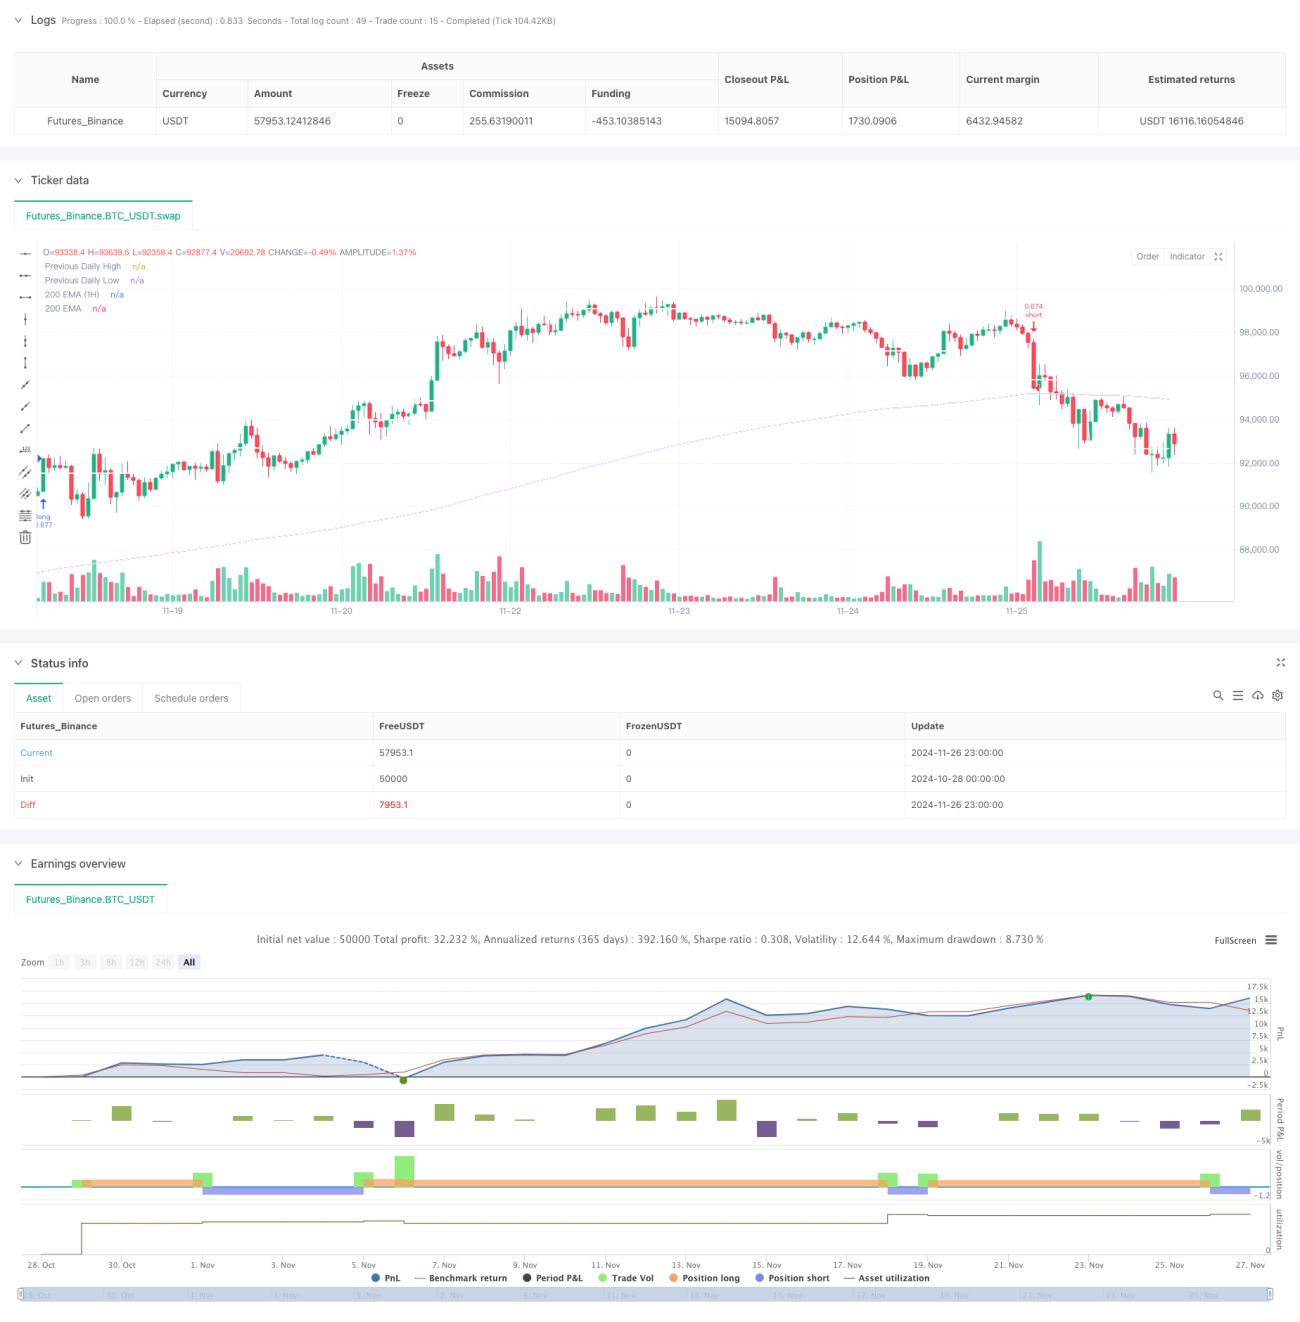
/*backtest
start: 2024-10-28 00:00:00
end: 2024-11-27 00:00:00
period: 1h
basePeriod: 1h
exchanges: [{"eid":"Futures_Binance","currency":"BTC_USDT"}]
*/

//@version=5
strategy(title='The security Daily HIGH/LOW strategy', overlay=true, initial_capital=10000, calc_on_every_tick=true,
         default_qty_type=strategy.percent_of_equity, default_qty_value=100,
commission_type=strategy.commission.percent, commission_value=0.1)- 1