概述
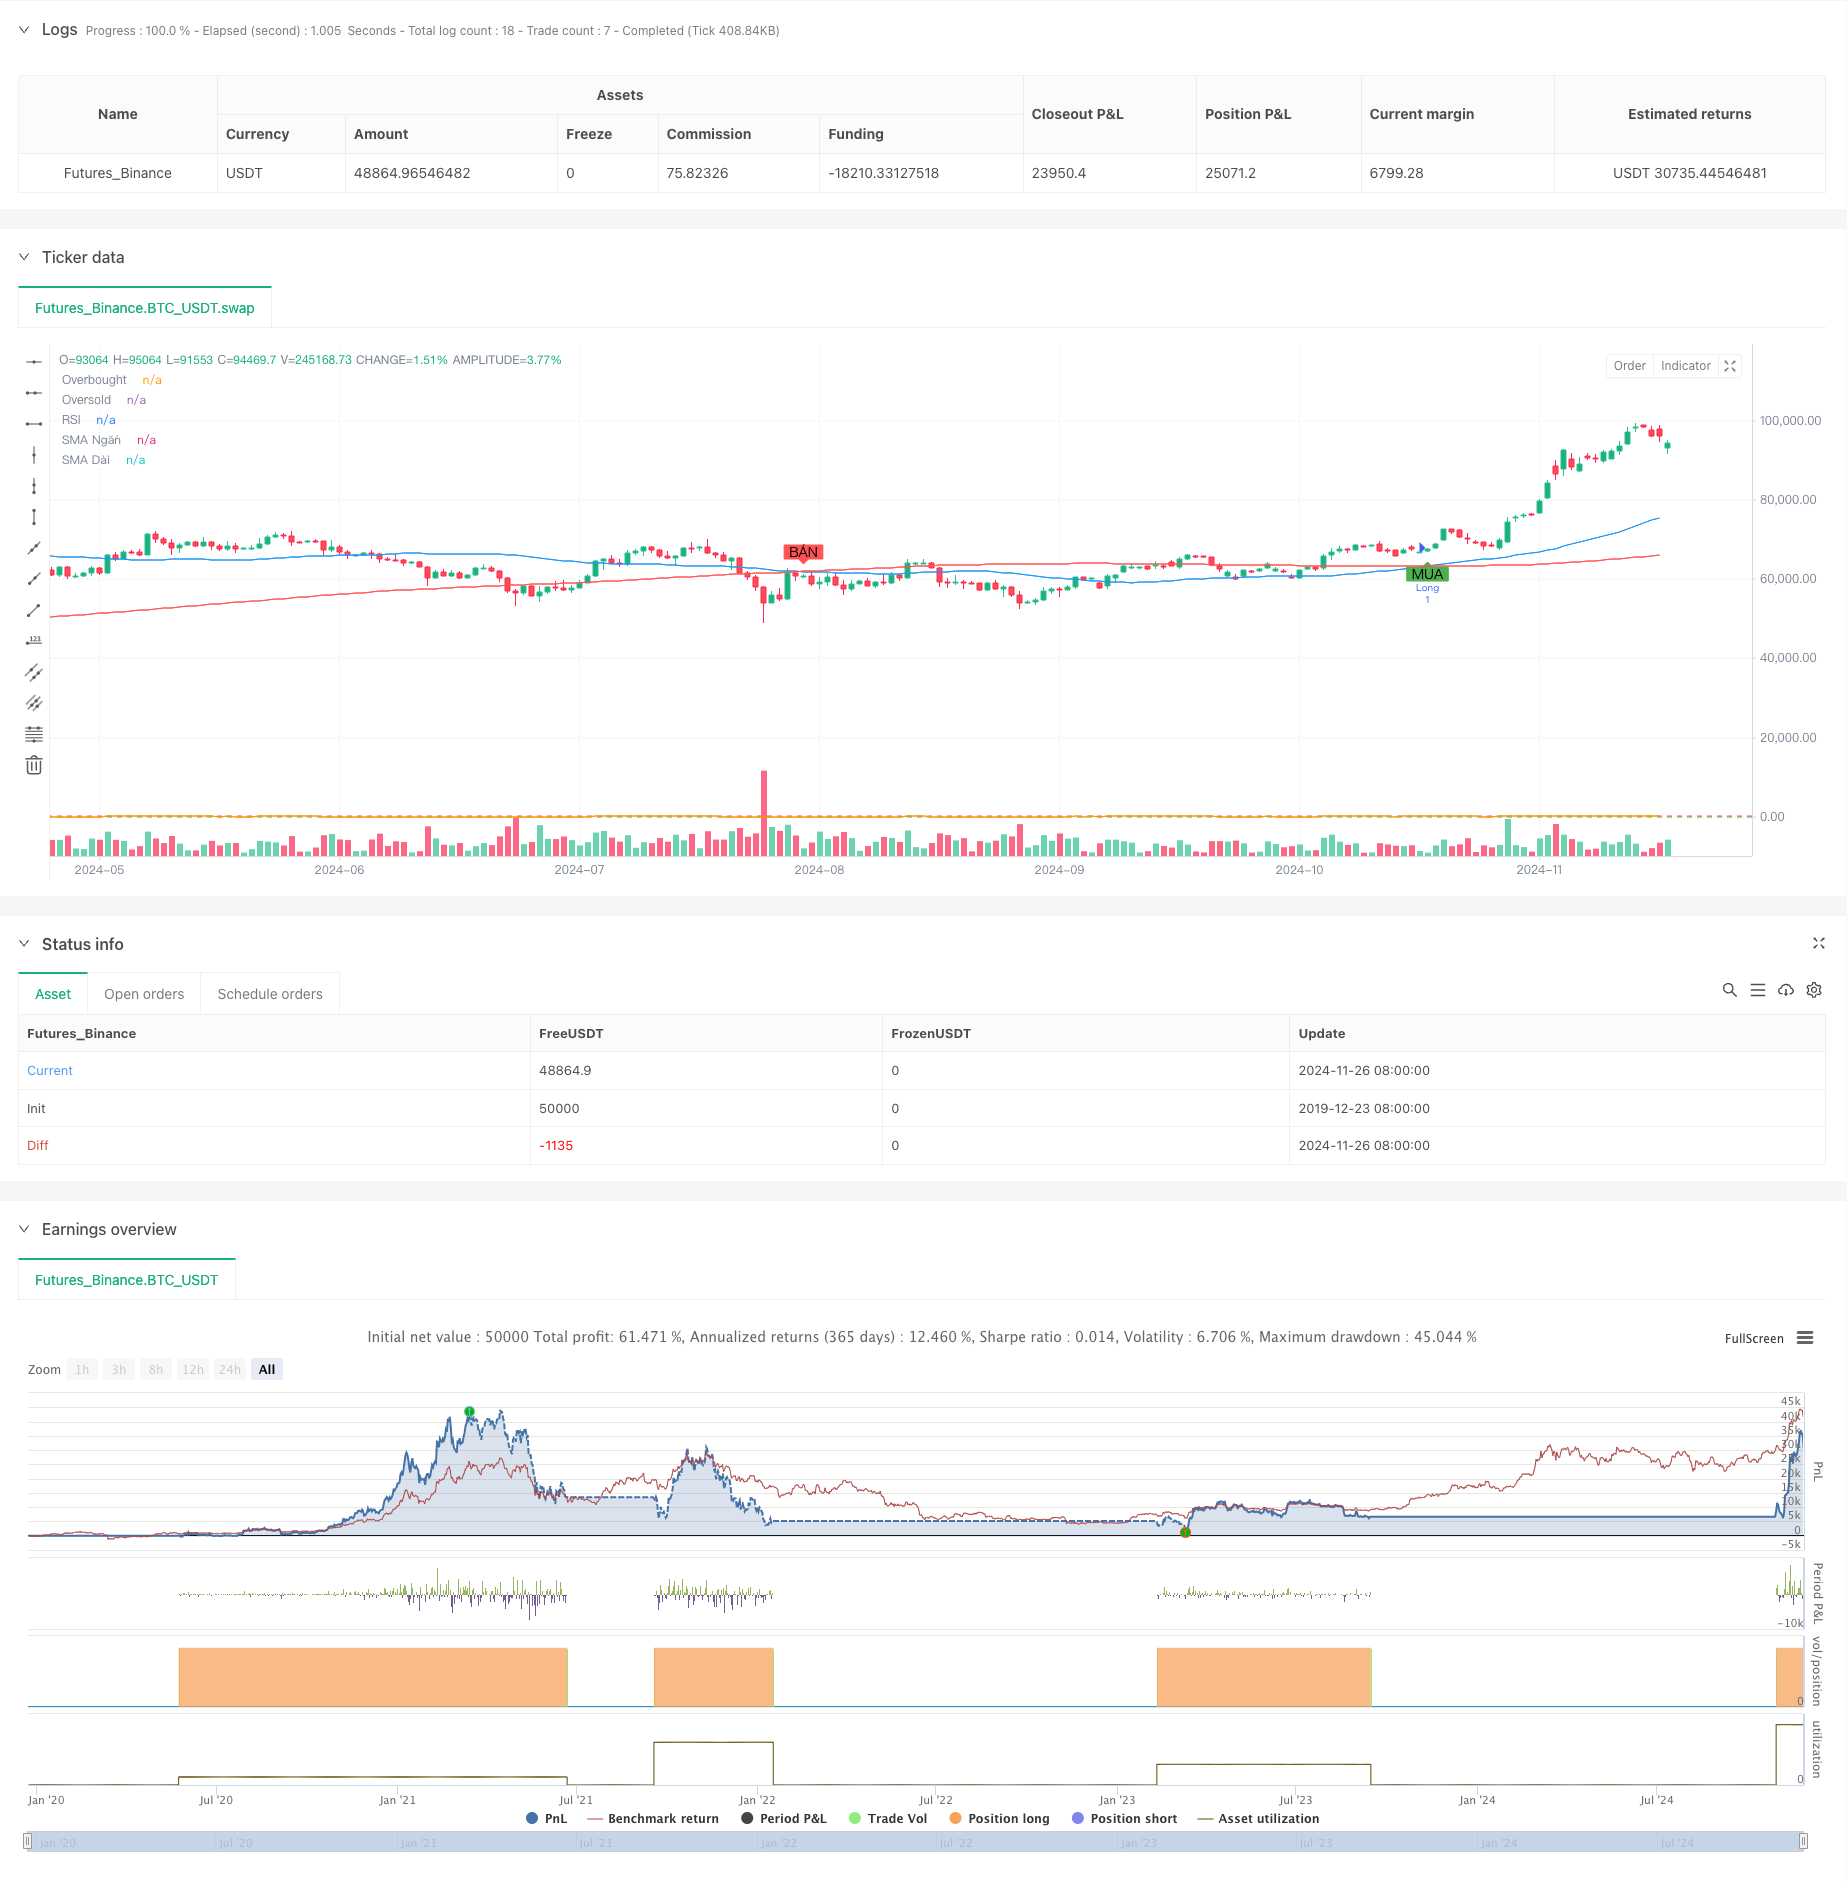
本策略是一个结合了移动平均线(SMA)和相对强弱指标(RSI)的量化交易系统。它通过观察短期和长期移动平均线的交叉信号,同时结合RSI指标的超买超卖水平来确定交易时机。该策略采用TradingView平台的Pine Script语言编写,能够实现自动化交易和图形化显示。
策略原理
策略的核心逻辑基于两个主要技术指标的配合使用。首先,系统计算50周期和200周期的简单移动平均线(SMA),这两条均线的交叉形成主要的趋势判断信号。其次,系统结合14周期的RSI指标,设定70和30作为超买超卖阈值,用于过滤交易信号。当短期均线向上穿越长期均线且RSI未达到超买水平时,系统产生做多信号;当短期均线向下穿越长期均线且RSI未达到超卖水平时,系统产生平仓信号。
策略优势
- 信号可靠性高:通过结合趋势指标(SMA)和动量指标(RSI),有效降低了假突破带来的风险。
- 参数可调性强:策略提供了多个可调参数,包括均线周期、RSI周期和阈值,便于根据不同市场环境进行优化。
- 视觉反馈清晰:在图表上清晰显示交易信号,包括不同颜色的均线和带有文字标注的买卖信号标记。
- 自动化程度高:支持完全自动化交易,无需人工干预。
策略风险
- 趋势反转风险:在市场急剧反转时,均线系统的滞后性可能导致较大回撤。
- 震荡市场风险:在横盘整理阶段,频繁的均线交叉可能产生过多虚假信号。
- 参数敏感性:不同的参数设置可能导致策略表现差异较大,需要经过充分的历史测试。
策略优化方向
- 增加趋势强度过滤:可以添加ADX等趋势强度指标,只在趋势明确时开仓。
- 引入止损机制:设置基于ATR或固定百分比的止损条件,控制单次交易风险。
- 优化出场机制:可以考虑在RSI达到极值时提前出场,或结合其他技术指标优化出场时机。
- 加入成交量确认:在交易信号生成时,结合成交量分析提高信号可靠性。
总结
该策略通过均线交叉和RSI超买超卖的双重过滤机制,构建了一个相对稳健的交易系统。它适合在有明显趋势的市场中应用,但需要投资者根据具体市场特点调整参数设置。通过添加更多的过滤条件和风险控制机制,策略的稳定性还可以进一步提升。在实盘应用时,建议先进行充分的回测验证,并结合市场实际情况进行适当的参数优化。
策略源码
/*backtest
start: 2019-12-23 08:00:00
end: 2024-11-27 00:00:00
period: 1d
basePeriod: 1d
exchanges: [{"eid":"Futures_Binance","currency":"BTC_USDT"}]
*/

//@version=5
strategy("Chỉ báo Giao dịch Cắt SMA với RSI", overlay=true)

// Định nghĩa các tham số
short_period = input.int(50, title="Thời gian SMA ngắn")
long_period = input.int(200, title="Thời gian SMA dài")
rsi_period = input.int(14, title="Thời gian RSI")
rsi_overbought = input.int(70, title="Ngưỡng RSI Mua Quá Mức")
rsi_oversold = input.int(30, title="Ngưỡng RSI Bán Quá Mức")

// Tính toán các SMA
sma_short = ta.sma(close, short_period)
sma_long = ta.sma(close, long_period)

// Tính toán RSI
rsi = ta.rsi(close, rsi_period)

// Điều kiện vào lệnh Mua (Cắt lên và RSI không quá mua)
long_condition = ta.crossover(sma_short, sma_long) and rsi < rsi_overbought

// Điều kiện vào lệnh Bán (Cắt xuống và RSI không quá bán)
short_condition = ta.crossunder(sma_short, sma_long) and rsi > rsi_oversold

// Vẽ các đường SMA và RSI lên biểu đồ
plot(sma_short, color=color.blue, title="SMA Ngắn")
plot(sma_long, color=color.red, title="SMA Dài")
hline(rsi_overbought, "Overbought", color=color.red)
hline(rsi_oversold, "Oversold", color=color.green)
plot(rsi, color=color.orange, title="RSI")

// Hiển thị tín hiệu vào lệnh
plotshape(series=long_condition, location=location.belowbar, color=color.green, style=shape.labelup, title="Tín hiệu Mua", text="MUA")
plotshape(series=short_condition, location=location.abovebar, color=color.red, style=shape.labeldown, title="Tín hiệu Bán", text="BÁN")

// Giao dịch tự động bằng cách sử dụng cấu trúc if
if (long_condition)
    strategy.entry("Long", strategy.long)

if (short_condition)
    strategy.close("Long")
相关推荐