概述
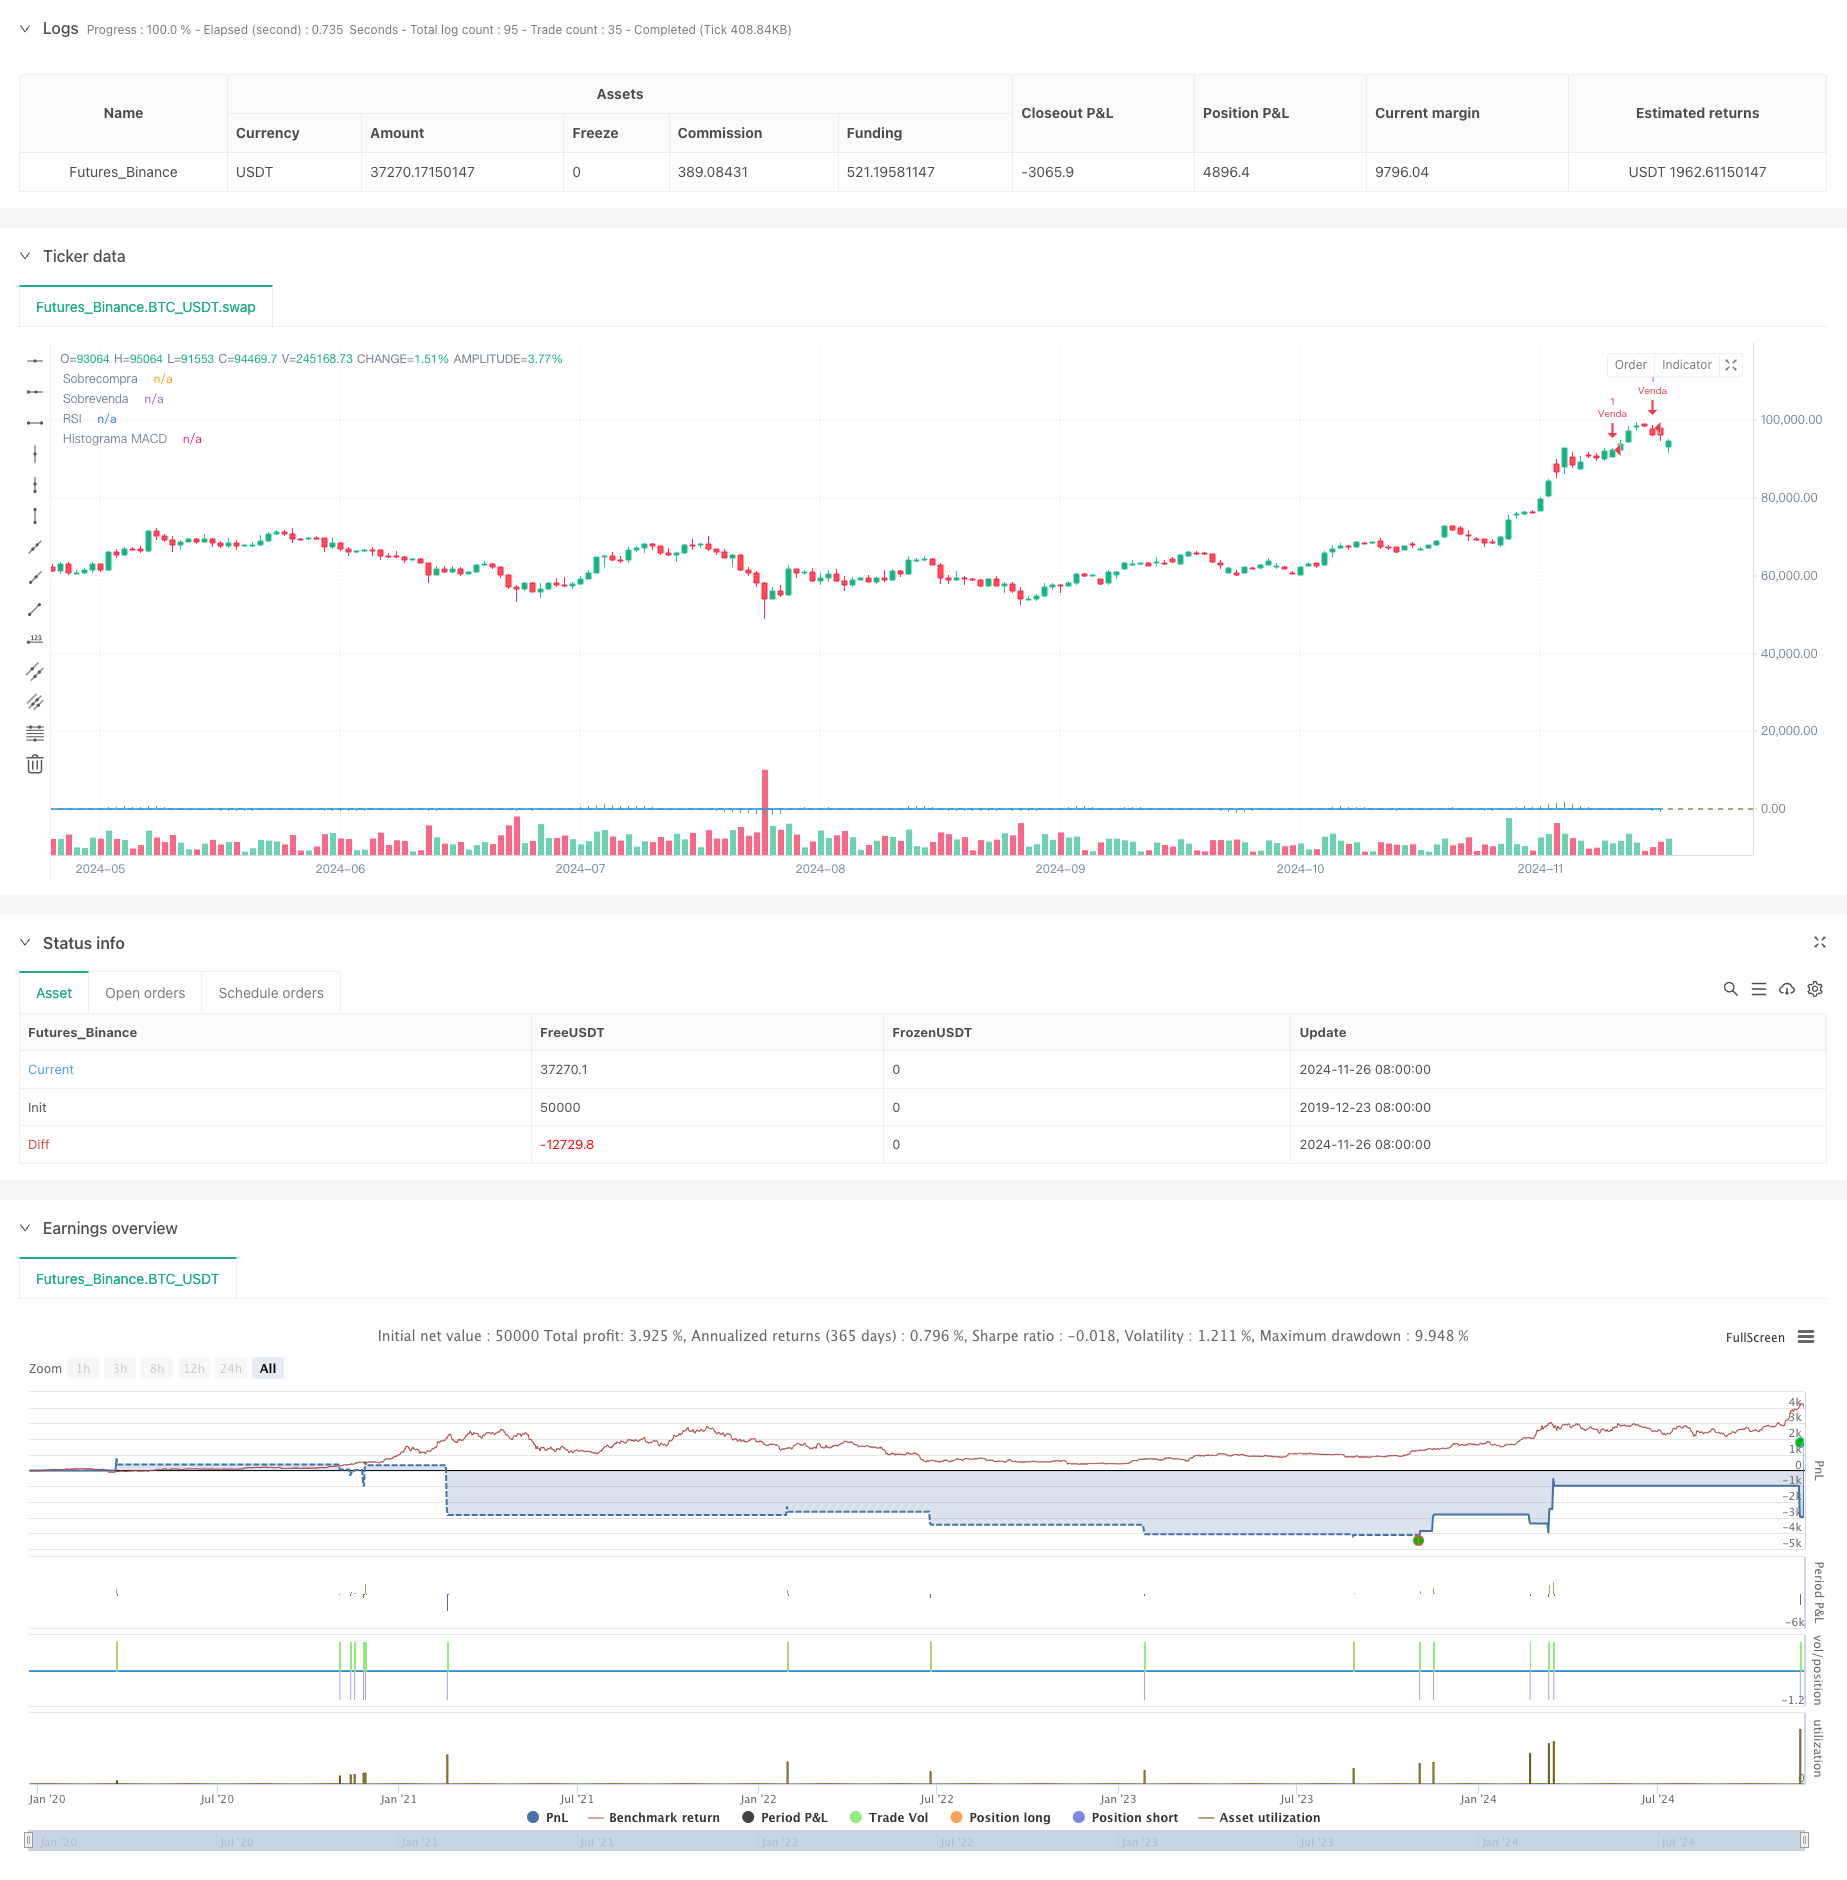
该策略是一个基于技术分析指标的交易系统,结合了RSI(相对强弱指数)和MACD(移动平均线趋同背离)双重信号确认机制,通过在超买超卖区间寻找交易机会,并采用动态止盈止损来管理风险。策略设计主要针对短线交易,适用于快速市场环境下的交易机会捕捉。
策略原理
策略运用RSI和MACD两个经典技术指标构建交易信号系统。买入信号在RSI低于35(超卖区域)且MACD出现金叉时触发;卖出信号在RSI高于70(超买区域)且MACD出现死叉时触发。系统采用300点止损和600点止盈的风险管理机制,这种2:1的盈亏比有助于在长期交易中获得正期望收益。
策略优势
- 双重信号确认机制提高了交易的准确性
- RSI和MACD指标组合能够有效过滤虚假信号
- 固定的风险收益比有利于长期稳定获利
- 策略参数可调整,具有良好的适应性
- 采用标签系统可视化交易信号,便于回测分析
- 短周期设置适合把握短线机会
策略风险
- 震荡市场可能产生频繁交易信号导致连续亏损
- 固定止损可能在剧烈波动中造成较大损失
- RSI和MACD属于滞后指标,可能错过最佳入场时机
- 短周期交易易受市场噪音影响
- 未设置时间过滤可能在不适合的时段交易
策略优化方向
- 引入趋势过滤器,避免震荡市场交易
- 增加波动率指标,动态调整止损水平
- 加入交易时间过滤,避开低流动性时段
- 考虑设置信号确认时间要求,减少虚假信号
- 优化仓位管理系统,根据市场波动调整交易量
- 增加移动止损功能,更好地保护盈利
总结
该策略通过结合RSI和MACD指标构建了一个相对可靠的交易系统,配合合理的止盈止损设置,具有一定的实战应用价值。但仍需要根据实际市场情况进行优化,特别是在风险控制和信号过滤方面需要进一步完善。策略的成功运行需要交易者对市场有深入理解,并能够灵活调整参数以适应不同市场环境。
策略源码
/*backtest
start: 2019-12-23 08:00:00
end: 2024-11-27 00:00:00
period: 1d
basePeriod: 1d
exchanges: [{"eid":"Futures_Binance","currency":"BTC_USDT"}]
*/

//@version=5
strategy("Scalping XAU/USD m5 (Protected)", overlay=true)

// Parâmetros do usuário
rsiPeriod = input(14, title="Período do RSI")
rsiOverbought = input(70, title="Nível de Sobrecompra do RSI")  // Ajustado para aumentar trades
rsiOversold = input(35, title="Nível de Sobrevenda do RSI")    // Ajustado para aumentar trades
macdFast = input(6, title="Média Rápida do MACD") // Ajustado para aumentar a frequência
macdSlow = input(13, title="Média Lenta do MACD")  // Ajustado para aumentar a frequência
macdSignal = input(7, title="Sinal do MACD")
lotSize = input(1, title="Tamanho do Lote")
slPips = input(300, title="Stop-Loss (pips)")  // Definido pelo usuário
tpPips = input(600, title="Take-Profit (pips)")  // Definido pelo usuário

// Cálculos do RSI e MACD
rsi = ta.rsi(close, rsiPeriod)
[macdLine, signalLine, _] = ta.macd(close, macdFast, macdSlow, macdSignal)

// Condições de compra
buyCondition = (rsi < rsiOversold) and (macdLine > signalLine) and (ta.crossover(macdLine, signalLine))

// Condições de venda
sellCondition = (rsi > rsiOverbought) and (macdLine < signalLine) and (ta.crossunder(macdLine, signalLine))

// Executa a compra
if (buyCondition)
    strategy.entry("Compra", strategy.long, qty=lotSize)
    label.new(bar_index, close, "Compra", color=color.green, style=label.style_label_up, textcolor=color.white, size=size.small)

// Executa a venda
if (sellCondition)
    strategy.entry("Venda", strategy.short, qty=lotSize)
    label.new(bar_index, close, "Venda", color=color.red, style=label.style_label_down, textcolor=color.white, size=size.small)

// Saídas com Stop-Loss e Take-Profit
if (strategy.position_size > 0)  // Para posições de compra
    strategy.exit("Saída Compra", from_entry="Compra", stop=close - slPips * syminfo.mintick, limit=close + tpPips * syminfo.mintick)

if (strategy.position_size < 0)  // Para posições de venda
    strategy.exit("Saída Venda", from_entry="Venda", stop=close + slPips * syminfo.mintick, limit=close - tpPips * syminfo.mintick)

// Plota o RSI e suas linhas de sobrecompra/sobrevenda
hline(rsiOverbought, "Sobrecompra", color=color.red)
hline(rsiOversold, "Sobrevenda", color=color.green)
plot(rsi, "RSI", color=color.blue)

// Plota o MACD
macdHist = macdLine - signalLine
plot(macdHist, title="Histograma MACD", color=color.green, style=plot.style_histogram)
相关推荐