Dual Momentum Squeeze Trading System (SMI+UBS Indicator Combination Strategy)

Overview
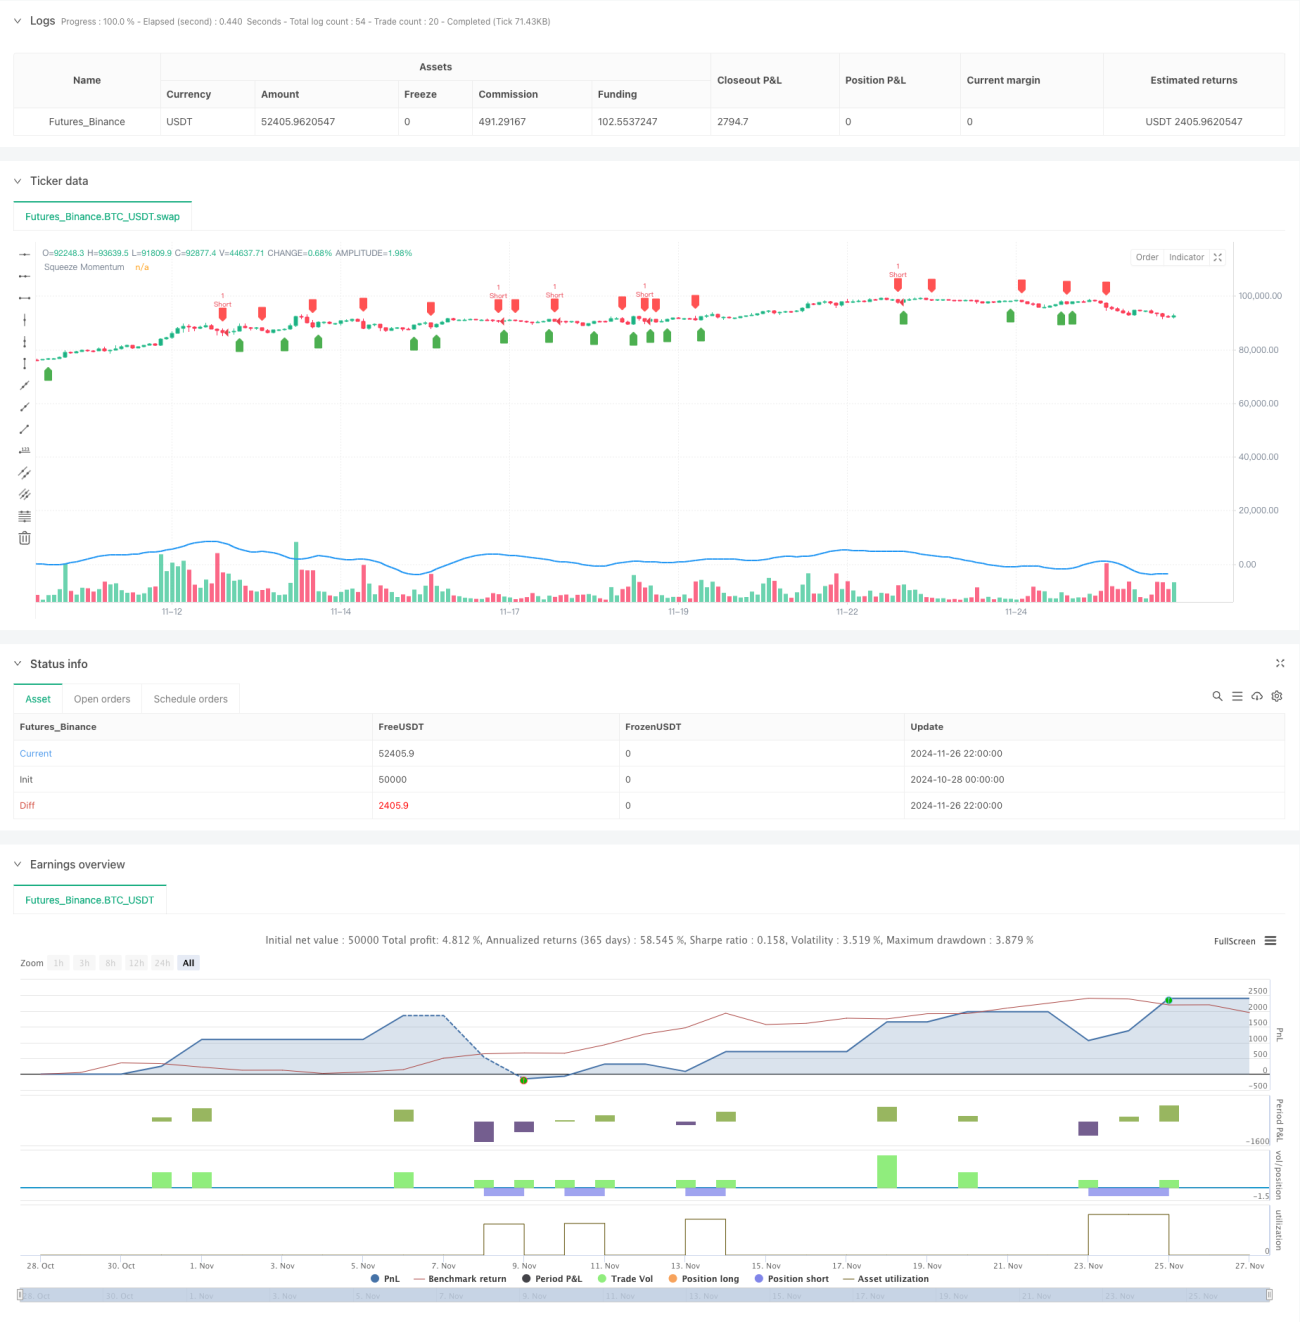
This strategy is a short-term trading system that combines the Squeeze Momentum Indicator (SMI) and Ultimate Buy/Sell (UBS) indicator. The strategy primarily captures short-selling opportunities by monitoring momentum changes and moving average crossover signals. The system incorporates a percentage-based stop-loss mechanism to protect capital while pursuing stable returns.
Strategy Principles
The core logic is based on the combination of two main indicators:
- Squeeze Momentum Indicator (SMI): Generates momentum signals by calculating the relationship between closing prices and high/low prices, smoothed with moving averages. When SMI turns from ascending to descending, it indicates weakening upward momentum and potential short opportunities.
- Ultimate Buy/Sell Indicator (UBS): Determines entry timing based on price crossovers with moving averages. A short signal is confirmed when price crosses below the moving average.
- The system automatically enters short positions upon signal confirmation, setting a 0.4% profit target and 2.5% stop-loss level for effective risk control.
Strategy Advantages
- Dual Signal Confirmation: Enhances signal reliability through the resonance of two independent indicators.
- Comprehensive Risk Management: Clear profit-taking and stop-loss conditions effectively control risk per trade.
- Adjustable Parameters: Key parameters like SMI length, smoothing period, and UBS period can be optimized for different market conditions.
- High Automation: Clear strategy logic facilitates automated trading implementation.
Strategy Risks
- False Breakout Risk: Frequent false signals may occur in ranging markets.
- Trend Dependency: Strategy performs better in trending markets but may face frequent stops in sideways markets.
- Parameter Sensitivity: Different parameter settings can lead to significant performance variations.
- Slippage Impact: Actual execution prices may deviate significantly from signal prices during high volatility.
Optimization Directions
- Add Market Environment Filters: Incorporate volatility or trend strength indicators to adjust strategy parameters in different market conditions.
- Optimize Stop-Loss Mechanism: Consider implementing dynamic stops, such as trailing stops or ATR-based stops.
- Add Time Filters: Avoid high volatility periods and major news release times.
- Implement Position Sizing: Dynamically adjust position size based on signal strength and market volatility.
Summary
The strategy constructs a relatively complete short-selling system by combining squeeze momentum and ultimate buy/sell technical indicators. Its strengths lie in high signal reliability and clear risk control, though it shows strong dependence on market conditions. Through improvements in market environment filtering and stop-loss optimization, the strategy's stability and profitability can be further enhanced.
/*backtest
start: 2024-10-28 00:00:00
end: 2024-11-27 00:00:00
period: 2h
basePeriod: 2h
exchanges: [{"eid":"Futures_Binance","currency":"BTC_USDT"}]
*/

// This Pine Script™ code is subject to the terms of the Mozilla Public License 2.0 at https://mozilla.org/MPL/2.0/
// © algostudio
// Code Generated using PineGPT - www.marketcalls.in
- 1