RSI Trend Momentum Trading Strategy with Dual MA and Volume Confirmation

Overview
This strategy is a trend-following system that combines RSI oversold signals, long-term moving averages, and volume confirmation. It aims to capture long positions during oversold conditions within established uptrends, validated by volume expansion. The strategy utilizes a 10-period RSI, dual SMAs of 250 and 500 periods, and a 20-period volume moving average as core indicators.
Strategy Principles
The core logic is based on three key conditions working in harmony:
- RSI oversold signal (RSI<=30): Captures market rebound opportunities
- Dual MA bullish alignment (SMA250>SMA500): Confirms long-term uptrend
- Volume confirmation (Current volume>20-period volume MA*2.5): Validates price movements
A long position is initiated when all three conditions are met simultaneously. The exit signal is triggered by a death cross (shorter MA crossing below longer MA). Additionally, a 5% stop-loss is implemented for risk management.
Strategy Advantages
- Multiple confirmation reduces false signals: Integration of RSI, MAs, and volume provides robust signal filtering
- Trend-following characteristics: Long-term MAs prevent counter-trend trading
- Comprehensive risk control: Fixed stop-loss effectively manages per-trade risk
- High adaptability: Parameters can be adjusted for different market conditions
- Strict trade selection: Multiple conditions ensure optimal entry timing
Strategy Risks
- Lag risk: Long-period MAs introduce significant delay in trend identification
- Over-filtering risk: Strict multiple conditions might miss valid trading opportunities
- Ranging market risk: False signals may occur frequently in sideways markets
- Stop-loss configuration risk: Fixed percentage stops may not suit all market conditions
- Parameter optimization risk: Over-optimization may lead to poor live trading performance
Optimization Directions
- Dynamic stop-loss: Consider implementing ATR or volatility-based dynamic stops
- Trend strength quantification: Incorporate ADX or similar indicators for better trend assessment
- Position sizing optimization: Adjust position size based on signal strength and market volatility
- Exit mechanism enhancement: Add profit targets and trailing stops for flexible exits
- Time filtering: Implement trading time filters to avoid inefficient periods
Summary
This is a well-designed trend-following strategy with rigorous logic, effectively balancing returns and risks through multiple technical indicators. Its core strengths lie in comprehensive signal confirmation and risk management systems, though it faces challenges in over-filtering and latency. Through the suggested optimization directions, the strategy shows potential for improved performance in practical applications.
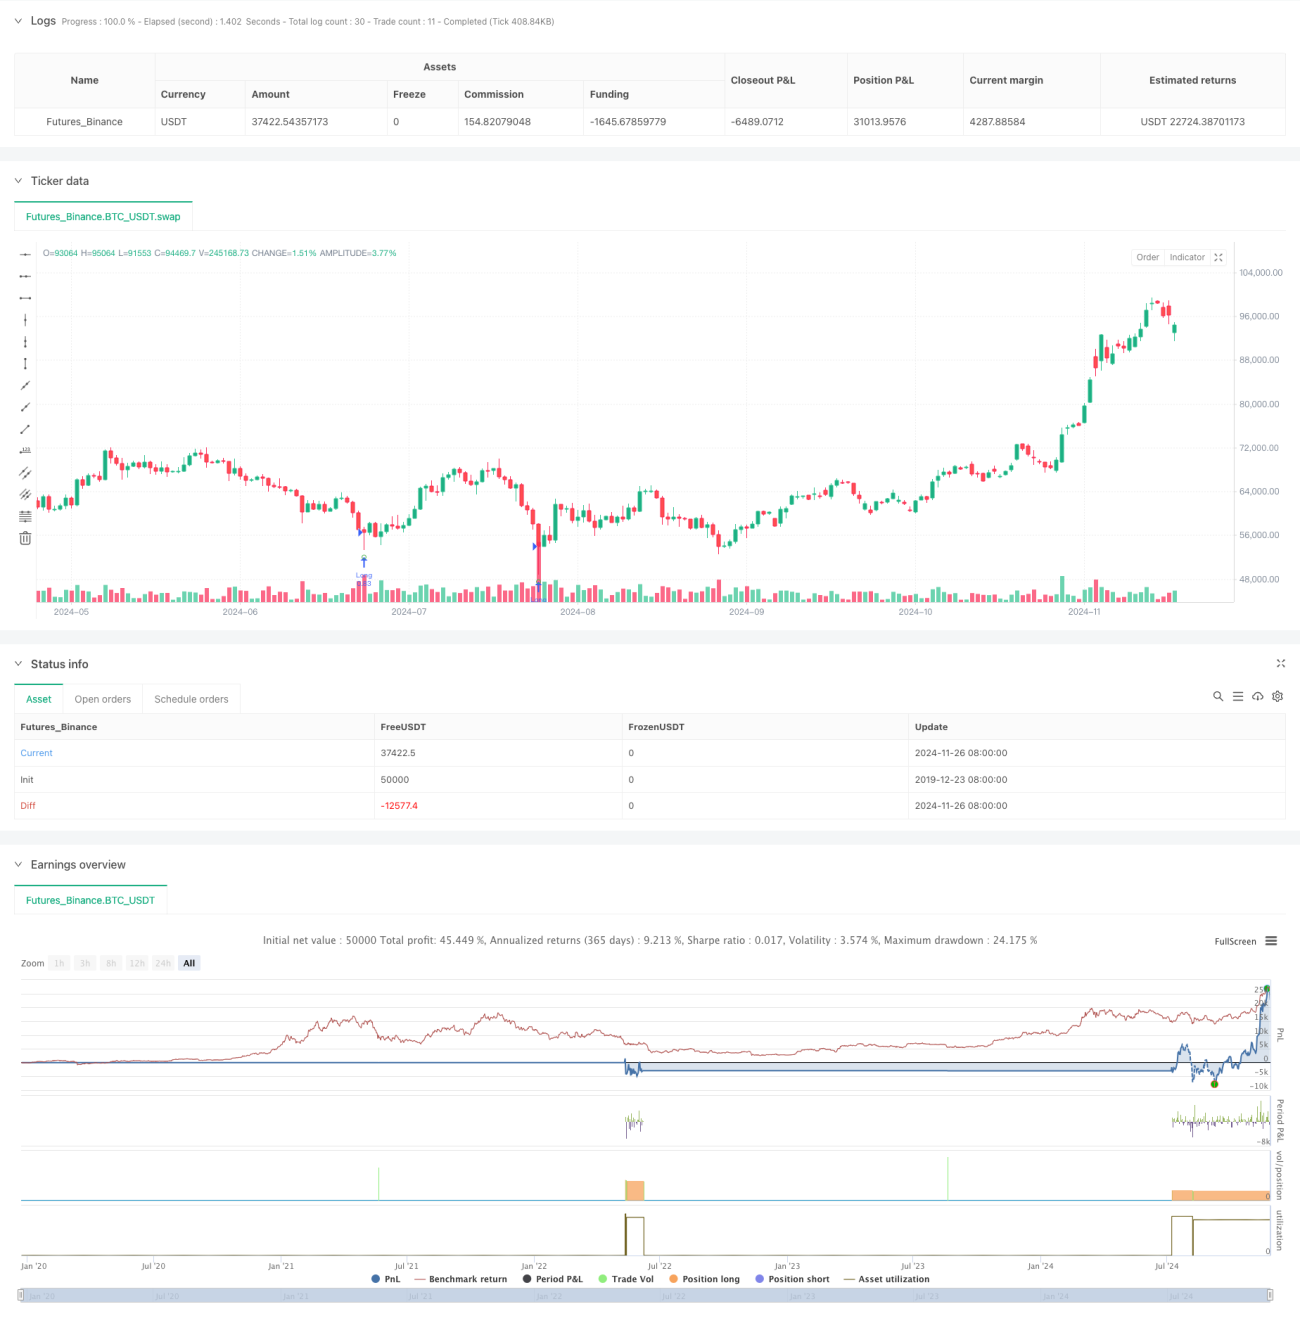
/*backtest
start: 2019-12-23 08:00:00
end: 2024-11-27 00:00:00
period: 1d
basePeriod: 1d
exchanges: [{"eid":"Futures_Binance","currency":"BTC_USDT"}]
*/


// This work is licensed under a Attribution-NonCommercial-ShareAlike 4.0 International (CC BY-NC-SA 4.0) https://creativecommons.org/licenses/by-nc-sa/4.0/
// © wielkieef
- 1