本策略通过将波林带(Bollinger Bands)和相对强弱指标(RSI)这两个经典技术指标相结合,形成了一个完整的交易系统。策略主要通过捕捉市场的波动性和动量变化来寻找交易机会,特别适合日内交易者使用。通过波林带来衡量市场波动性,同时结合RSI指标来确认价格的超买超卖状态,从而产生更加可靠的交易信号。
策略的核心逻辑在于将价格波动性指标与动量指标相结合。波林带由20日简单移动平均线作为中轨,上下轨道则是中轨加减2.5倍标准差。当价格触及下轨且RSI低于30时,系统会发出做多信号;当价格突破上轨且RSI高于70时,系统会发出平仓信号。此外,策略还设置了当RSI回升至50以上时的额外平仓条件,这有助于及时锁定利润。策略的设计充分考虑了市场的波动特性和价格动量的变化规律。
该策略通过巧妙结合波林带和RSI指标,构建了一个逻辑严密、操作性强的交易系统。策略的主要优势在于信号可靠性高、风险控制完善,同时具有较强的适应性。虽然在某些市场环境下可能面临一些挑战,但通过持续优化和改进,策略的整体表现仍具有较好的应用价值。建议交易者在实际应用中要注意市场环境的变化,灵活调整策略参数,并始终做好风险控制。
This strategy combines Bollinger Bands and Relative Strength Index (RSI) to form a comprehensive trading system. It primarily seeks trading opportunities by capturing market volatility and momentum changes, particularly suitable for intraday traders. The strategy uses Bollinger Bands to measure market volatility while incorporating RSI to confirm overbought and oversold conditions, generating more reliable trading signals.
The core logic combines volatility and momentum indicators. Bollinger Bands consist of a 20-day simple moving average as the middle band, with upper and lower bands set at 2.5 standard deviations. Buy signals are generated when price touches the lower band and RSI is below 30, while exit signals occur when price breaks above the upper band and RSI exceeds 70. Additionally, the strategy includes an extra exit condition when RSI rises above 50, helping to secure profits. The design thoroughly considers market volatility characteristics and price momentum patterns.
The strategy cleverly combines Bollinger Bands and RSI indicators to build a logically rigorous and highly operable trading system. Its main advantages lie in high signal reliability and comprehensive risk control, while maintaining strong adaptability. Although it may face challenges in certain market environments, the strategy maintains good practical value through continuous optimization and improvement. Traders should pay attention to changing market conditions, flexibly adjust strategy parameters, and always maintain proper risk control in practical applications.
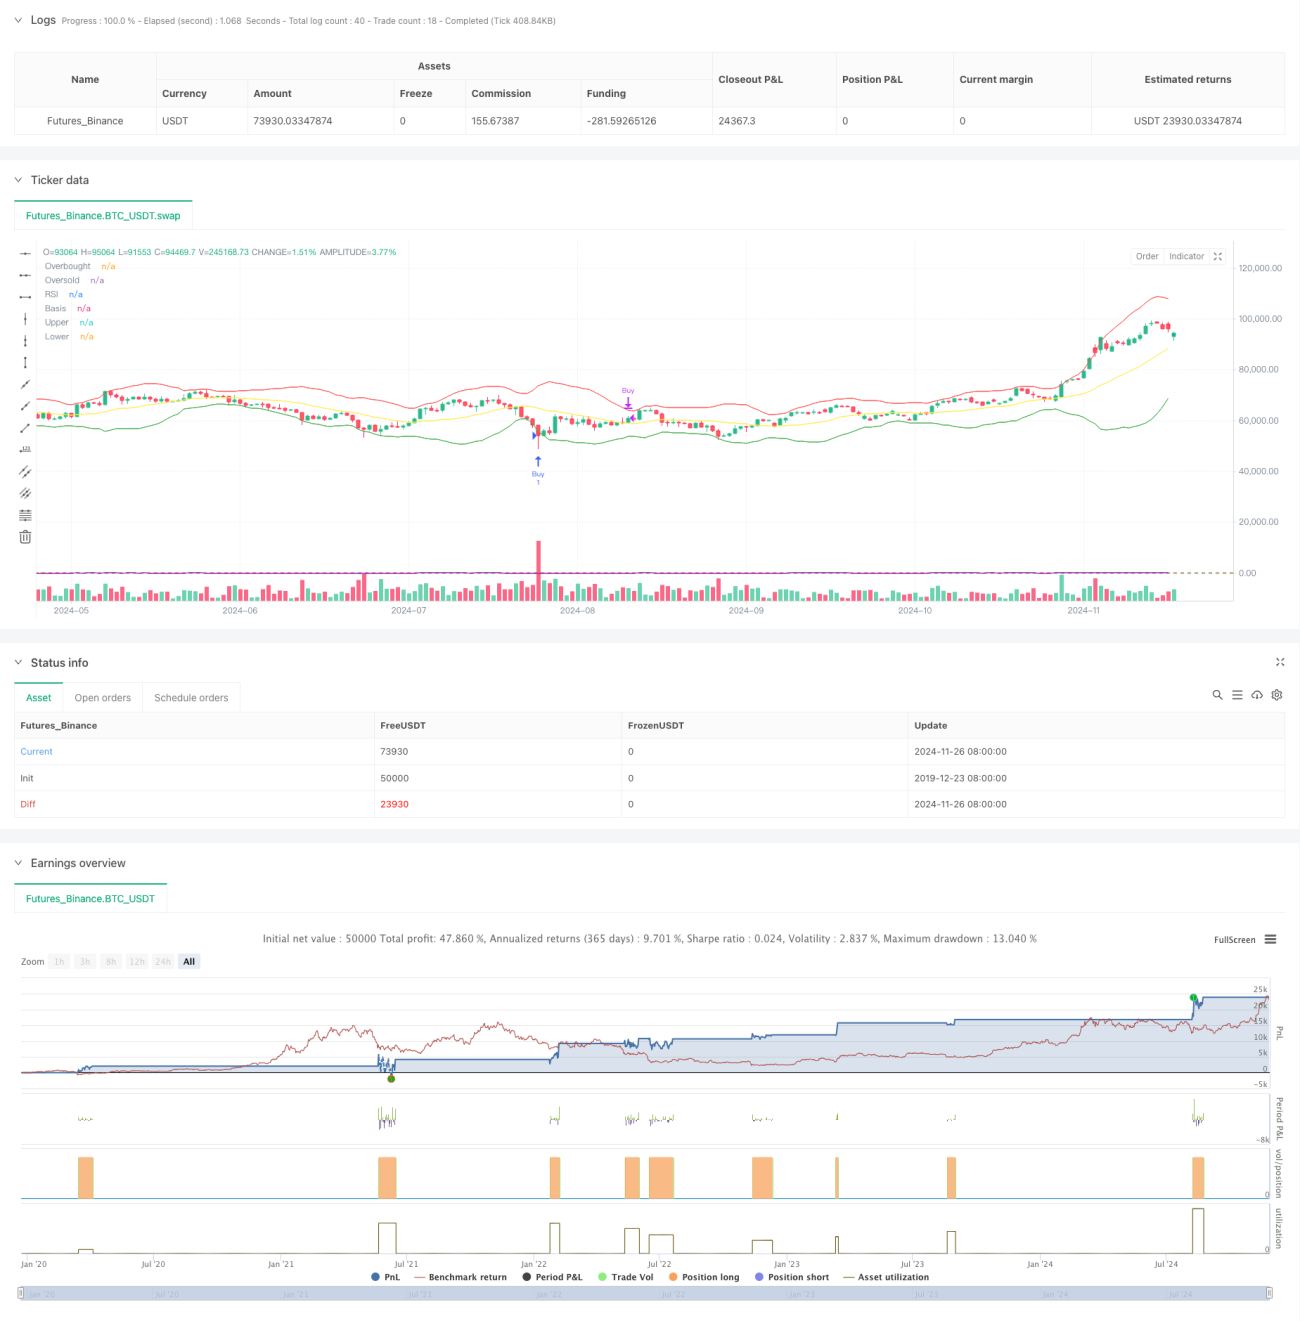
/*backtest
start: 2019-12-23 08:00:00
end: 2024-11-27 00:00:00
period: 1d
basePeriod: 1d
exchanges: [{"eid":"Futures_Binance","currency":"BTC_USDT"}]
*/
//@version=5
strategy("Bollinger Bands + RSI Strategy", shorttitle="BB_RSI", overlay=true)
// Define the Bollinger Bands parameters
length = input(20, title="Length")
mult = input(2.5, title="Multiplier")
basis = ta.sma(close, length)
dev = mult * ta.stdev(close, length)
upper = basis + dev
lower = basis - dev
// Define the RSI parameters
rsiLength = input(14, title="RSI Length")
rsiOverbought = input(70, title="RSI Overbought Level")
rsiOversold = input(30, title="RSI Oversold Level")
rsi = ta.rsi(close, rsiLength)
// Plot the Bollinger Bands and RSI
plot(basis, "Basis", color=color.yellow)
p1 = plot(upper, "Upper", color=color.red)
p2 = plot(lower, "Lower", color=color.green)
fill(p1, p2, color=color.rgb(255, 255, 255, 90))
hline(rsiOverbought, "Overbought", color=color.red)
hline(rsiOversold, "Oversold", color=color.green)
// Generate Buy and Sell signals
buyCondition = close < lower and rsi < rsiOversold
sellCondition = close > upper and rsi > rsiOverbought
if (buyCondition)
strategy.entry("Buy", strategy.long)
if (sellCondition)
strategy.close("Buy")
// Optional: Add exit strategy for buys
exitCondition = rsi > 50
if (exitCondition)
strategy.close("Buy")
// Plot RSI on a separate panel
plot(rsi, "RSI", color=color.purple)