
Overview
This strategy is an intelligent trading system that combines classical technical analysis tools including moving average crossovers and candlestick pattern recognition. The strategy identifies potential market turning points by analyzing the relationship between candlestick shadows and bodies, while incorporating dual moving average crossover signals. The system not only focuses on price trends but also calculates average ranges to dynamically adjust trading parameters for improved adaptability.
Strategy Principles
The core logic consists of two main components:
-
The candlestick pattern recognition module identifies potential reversal signals by calculating the ratio between shadows and bodies. The system includes adjustable parameters for shadow multiplier (wickMultiplier) and body percentage (bodyPercentage) to optimize signal quality. When a candlestick displays qualifying long upper or lower shadows, the system generates corresponding long or short signals.
-
The dual moving average crossover system utilizes 14-period and 28-period Simple Moving Averages (SMA) as trend indicators. Long signals are generated when the short-term MA crosses above the long-term MA, while short signals occur when the short-term MA crosses below the long-term MA.
Strategy Advantages
- Strict Signal Filtering: Effectively filters out low-quality signals through shadow multiplier and body percentage thresholds
- Strong Parameter Adaptability: Provides flexible parameter adjustment interfaces for optimizing strategy performance across different market conditions
- Combines Trend Following and Reversal Signals: Captures both trending markets and important reversal opportunities
- Comprehensive Risk Control: Utilizes 50-period average range calculations to dynamically adjust trading parameters for enhanced stability
Strategy Risks
- Parameter Sensitivity: Different parameter settings may lead to significant performance variations, requiring thorough optimization
- Market Environment Dependency: May generate excessive false signals in ranging markets, increasing trading costs
- Slippage Impact: Potential for significant slippage in markets with poor liquidity
- Signal Delay: Moving average systems have inherent lag, possibly missing optimal entry points
Strategy Optimization Directions
- Incorporate Volume Indicators: Analyze volume changes to confirm reversal signal validity
- Enhance Dynamic Parameter Adjustment: Automatically adjust shadow multiplier and body percentage parameters based on market volatility
- Add Trend Strength Filtering: Integrate RSI or ADX indicators to filter signals in weak market conditions
- Improve Stop-Loss Mechanism: Design dynamic stop-loss positions based on ATR indicator for more precise risk control
Summary
This strategy constructs a relatively complete trading decision framework by combining candlestick pattern recognition with moving average crossover systems. Its strengths lie in strict signal filtering mechanisms and flexible parameter adjustment capabilities, while attention must be paid to parameter optimization and market environment adaptability. Through continuous optimization and refinement, the strategy shows potential for maintaining stable performance across various market conditions.
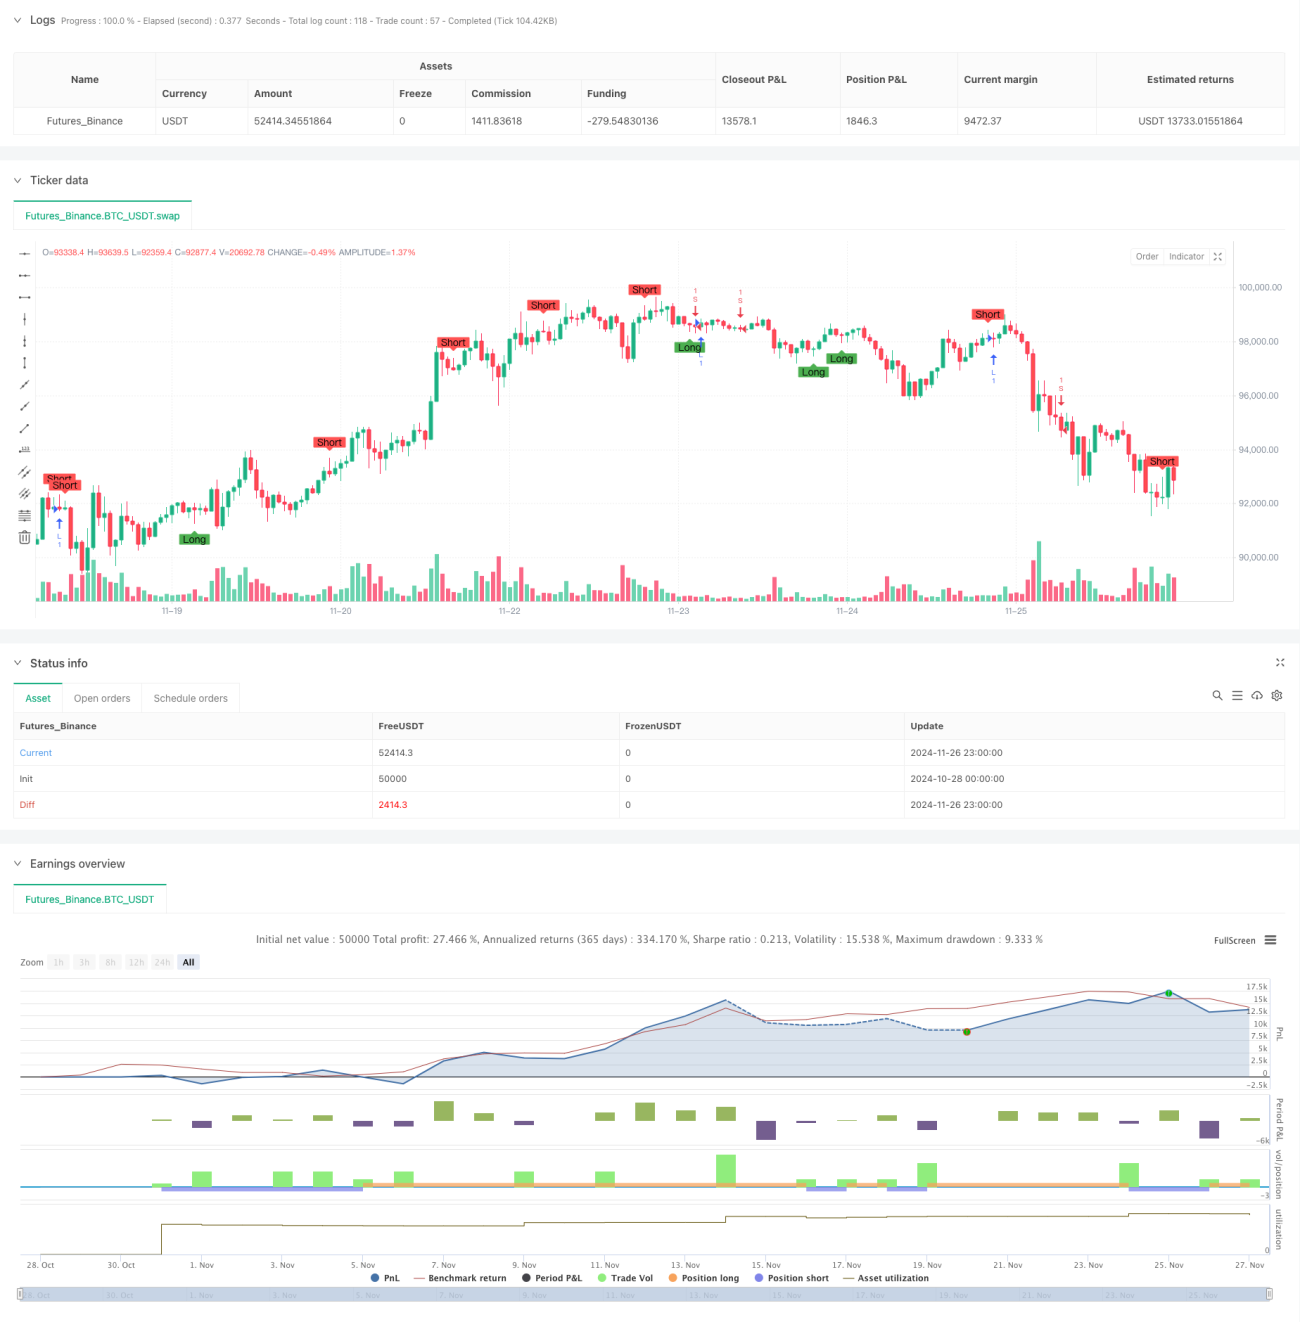
/*backtest
start: 2024-10-28 00:00:00
end: 2024-11-27 00:00:00
period: 1h
basePeriod: 1h
exchanges: [{"eid":"Futures_Binance","currency":"BTC_USDT"}]
*/

//@version=5 indicator("Wick Reversal Setup", overlay=true)

// Input parameters
wickMultiplier = input.float(3.5, title="Wick Multiplier", minval=0.5, maxval=20)- 1