概述
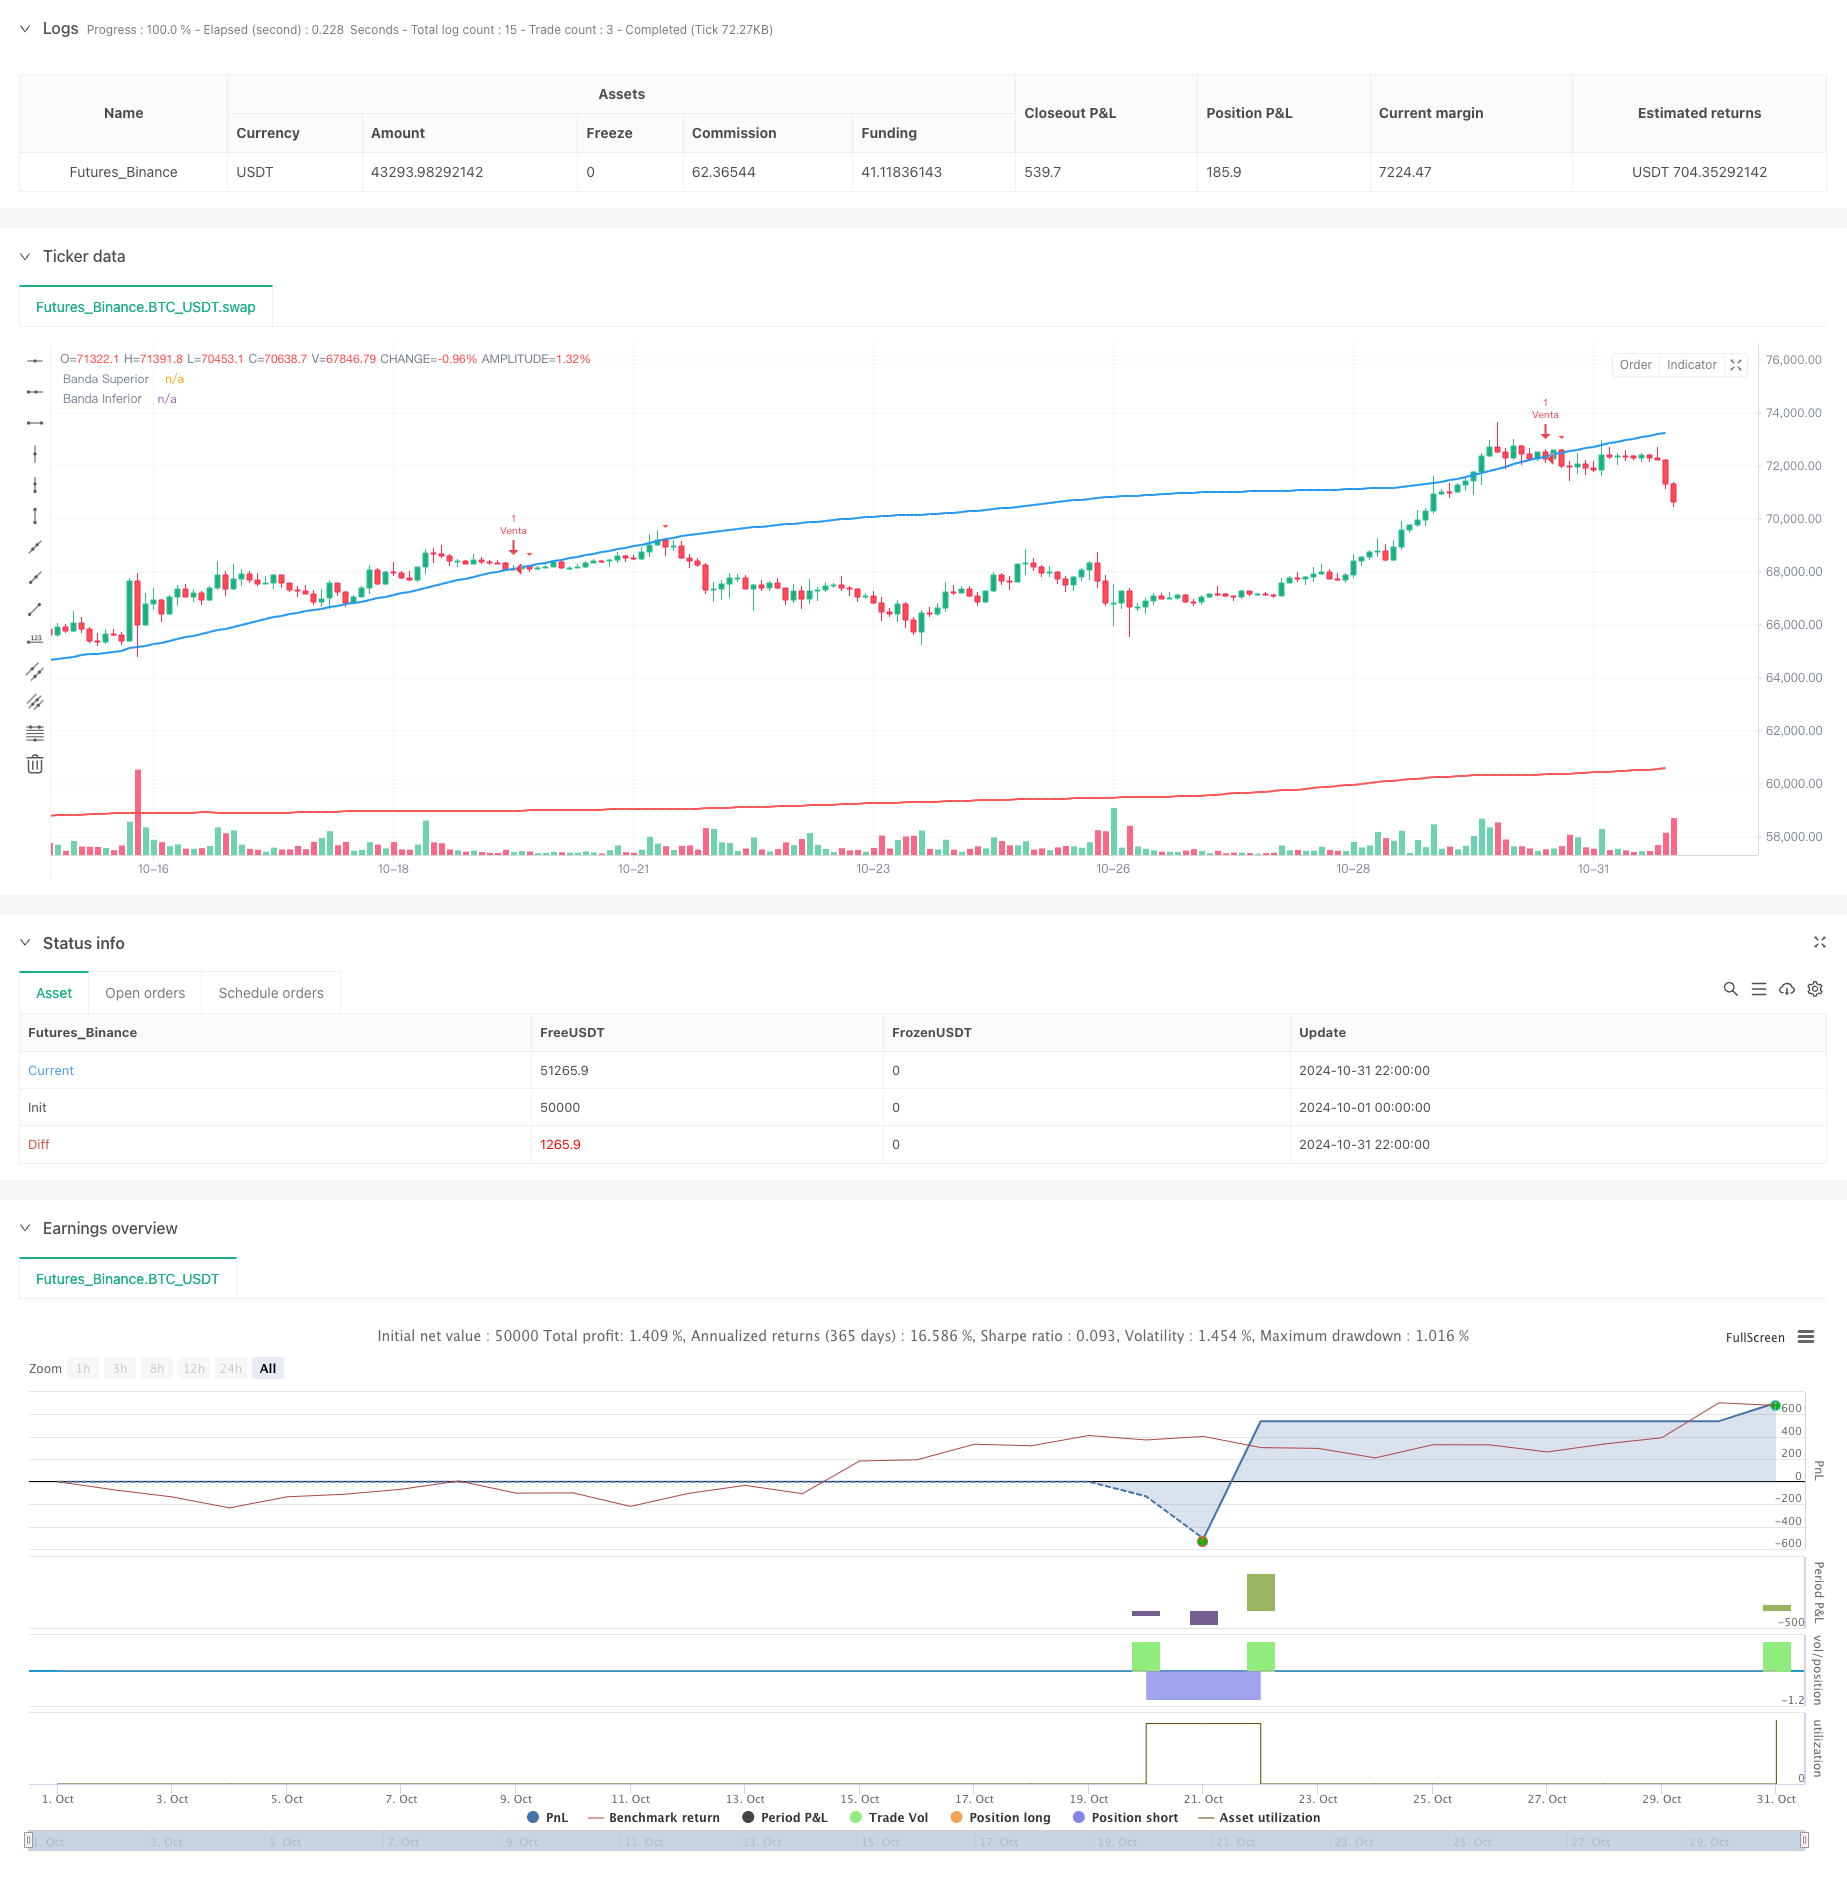
本策略是一个基于300周期指数移动平均线(EMA)构建的波动带交易系统。通过结合EMA和标准差,形成了类似布林带的动态波动区间,用于捕捉市场的超买超卖机会。该策略主要通过价格与波动带的交叉来产生交易信号,并设置了基于百分比的止盈条件。
策略原理
策略的核心是通过300周期EMA建立价格中枢,再利用标准差构建上下波动带。当价格突破下轨时视为超卖产生做多信号,突破上轨时视为超买产生做空信号。具体包括: 1. 利用300周期EMA建立长期趋势基准线 2. 计算300周期价格标准差,并以2倍标准差构建波动带 3. 价格突破下轨时开仓做多,止盈位为开仓价格上涨0.98% 4. 价格突破上轨时开仓做空,止盈位为开仓价格下跌0.98% 5. 通过图形界面直观显示交易信号,并配备实时预警功能
策略优势
- 系统采用长周期EMA,能较好过滤短期市场噪音
- 动态波动带可自适应市场波动率变化
- 明确的交易规则,避免主观判断带来的干扰
- 具备完善的止盈机制,有效控制风险
- 图形界面直观,便于观察市场状态
- 实时预警功能有助于及时把握交易机会
策略风险
- 长周期均线存在滞后性,可能错过快速行情
- 在震荡市场中可能产生频繁假突破
- 固定百分比止盈可能过早离场,错过大行情
- 未设置止损机制,在趋势剧烈反转时风险较大 建议采取以下措施管理风险:
- 结合短周期指标辅助判断
- 增加趋势确认过滤器
- 动态调整止盈百分比
- 补充止损机制
策略优化方向
- 引入趋势确认指标,如MACD、RSI等,过滤假突破信号
- 采用ATR动态调整止盈止损位置
- 增加移动止损功能,更好地锁定利润
- 优化长度参数,寻找最优周期组合
- 考虑加入成交量指标,提高信号可靠性
- 开发自适应参数机制,提升策略适应性
总结
该策略通过EMA波动带捕捉市场超买超卖机会,交易规则明确,操作简单。但在实际应用中需要注意控制风险,建议通过增加辅助指标、优化参数设置等方式提升策略稳定性。策略整体设计合理,具有较好的实用价值和优化空间。
策略源码
/*backtest
start: 2024-10-01 00:00:00
end: 2024-10-31 23:59:59
period: 2h
basePeriod: 2h
exchanges: [{"eid":"Futures_Binance","currency":"BTC_USDT"}]
*/

//@version=5
strategy("Estrategia de Compra/Venta en Bandas de EMA 300", overlay=true)

// Definir el período de la EMA
periodo = input.int(300, title="Período de la EMA")

// Calcular la EMA de 300
ema_300 = ta.ema(close, periodo)

// Definir el número de desviaciones estándar
num_desviaciones = input.float(2, title="Número de Desviaciones Estándar")

// Calcular la desviación estándar de la EMA de 300
desviacion = ta.stdev(close, periodo)

// Calcular los límites superior e inferior de las bandas
banda_superior = ema_300 + desviacion * num_desviaciones
banda_inferior = ema_300 - desviacion * num_desviaciones

// Definir el porcentaje para las señales de compra y venta
porcentaje = input.float(0.98, title="Porcentaje de Salida de Banda")

// Definir señales de compra y venta
compra = ta.crossover(close, banda_inferior)
venta = ta.crossunder(close, banda_superior)

// Calcular el precio de salida para las señales de compra y venta
precio_salida_compra = close * (1 + porcentaje / 100)
precio_salida_venta = close * (1 - porcentaje / 100)

// Plotear las bandas
plot(banda_superior, color=color.blue, linewidth=2, title="Banda Superior")
plot(banda_inferior, color=color.red, linewidth=2, title="Banda Inferior")

// Plotear las señales de compra y venta
plotshape(compra, style=shape.triangleup, location=location.belowbar, color=color.green, size=size.small, title="Compra")
plotshape(venta, style=shape.triangledown, location=location.abovebar, color=color.red, size=size.small, title="Venta")

// Simular operaciones
if (compra)
    strategy.entry("Compra", strategy.long)
if (venta)
    strategy.entry("Venta", strategy.short)

// Definir reglas de salida
if (strategy.position_size > 0)
    strategy.exit("Exit Long", from_entry="Compra", limit=precio_salida_compra)
if (strategy.position_size < 0)
    strategy.exit("Exit Short", from_entry="Venta", limit=precio_salida_venta)

// Crear alertas
alertcondition(compra, title="Alerta de Compra", message="¡Señal de Compra Detectada!")
alertcondition(venta, title="Alerta de Venta", message="¡Señal de Venta Detectada!")

// Mostrar alertas en el gráfico
if (compra)
    label.new(bar_index, low, text="Compra", style=label.style_label_up, color=color.green, textcolor=color.white)
if (venta)
    label.new(bar_index, high, text="Venta", style=label.style_label_down, color=color.red, textcolor=color.white)
相关推荐