概述
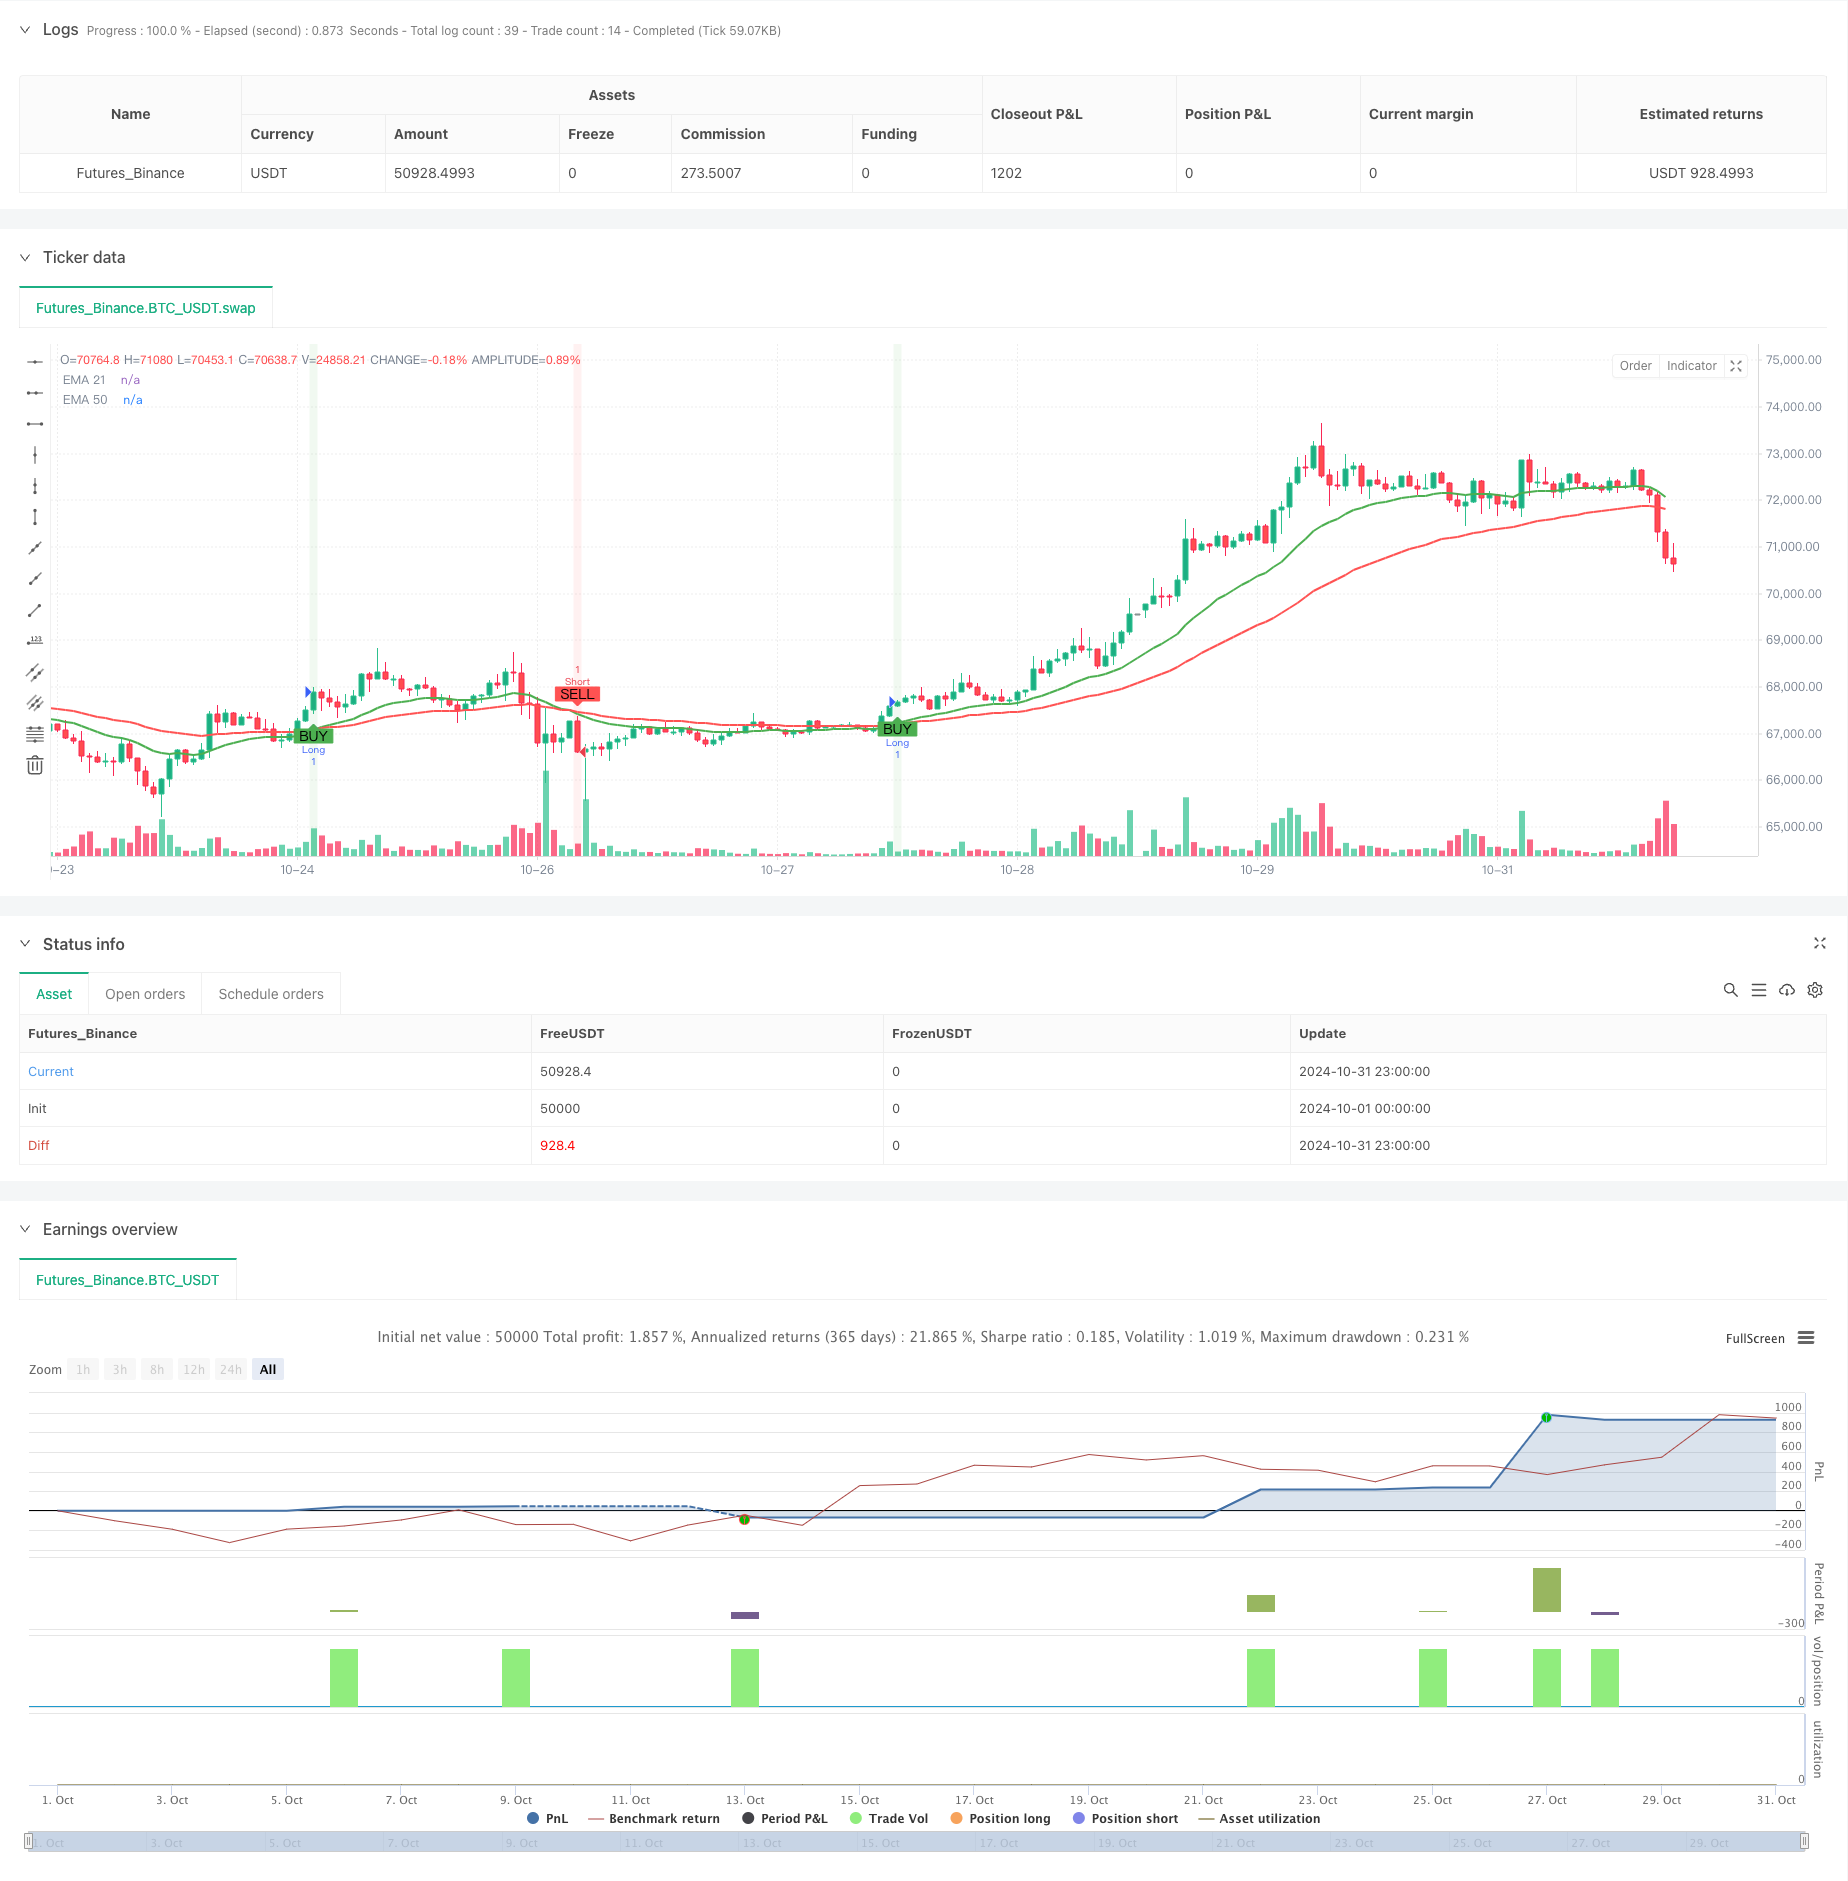
本策略是一个基于双均线突破理论的自动化交易系统,结合了风险管理功能。策略核心采用21周期和50周期的指数移动平均线(EMA)作为信号指标,通过均线交叉来判断市场趋势变化并自动执行交易。系统集成了止损(Stop Loss)和止盈(Take Profit)功能,可以有效控制每笔交易的风险和收益目标。
策略原理
策略的核心逻辑基于技术分析中经典的均线交叉理论。当短周期(21日)EMA向上穿越长周期(50日)EMA时,系统识别为看涨信号并开仓做多;当短周期EMA向下穿越长周期EMA时,系统识别为看跌信号并开仓做空。每个交易信号都会自动设置止损和止盈点位,系统默认将止损设置为40个最小波动单位,止盈设置为80个最小波动单位。这种设计确保了交易的风险收益比为1:2,符合专业交易管理原则。
策略优势
- 自动化程度高:系统完全自动化运行,从信号识别到交易执行再到风险管理都无需人工干预
- 风险管理完善:每笔交易都设有明确的止损止盈点位,有效控制风险
- 参数可调节:止损止盈点位可根据不同市场情况灵活调整
- 视觉反馈清晰:系统通过箭头标记买卖信号点,并用虚线标示止损止盈位置
- 策略逻辑简单:使用经典技术指标,易于理解和维护
策略风险
- 震荡市场风险:在横盘震荡市场中可能频繁触发假信号
- 滑点风险:在市场波动剧烈时可能出现实际成交价格与信号价格的偏差
- 趋势反转风险:当市场趋势突然反转时,固定的止损位可能不足以规避风险
- 参数优化风险:过度优化参数可能导致过拟合,影响策略在实盘中的表现
策略优化方向
- 增加趋势过滤器:引入额外的趋势判断指标,如ADX或趋势强度指数,过滤震荡市场中的假信号
- 动态止损机制:根据市场波动率自动调整止损止盈点位,提高风险管理的灵活性
- 增加交易时间过滤:避免在重要新闻发布等高波动期间交易
- 引入仓位管理:根据市场波动性和账户风险度自动调整开仓规模
- 优化信号确认机制:增加成交量等辅助指标,提高信号可靠性
总结
这是一个设计合理、逻辑清晰的自动化交易策略。通过结合均线交叉信号和严格的风险管理,策略在保障交易安全的同时,为把握市场趋势机会提供了可靠的技术框架。虽然存在一定的优化空间,但策略的基础架构完整,适合作为量化交易系统的基础模块进行进一步开发和完善。
策略源码
/*backtest
start: 2024-10-01 00:00:00
end: 2024-10-31 23:59:59
period: 1h
basePeriod: 1h
exchanges: [{"eid":"Futures_Binance","currency":"BTC_USDT"}]
*/

//@version=5
strategy("EMA Crossover Strategy with SL & TP", overlay=true, default_qty_type=strategy.percent_of_equity)

// Input settings for SL and TP (ticks)
slTicks = input.int(40, title="Stop Loss (ticks)", minval=1)
tpTicks = input.int(80, title="Take Profit (ticks)", minval=1)

// Define EMA periods
ema21 = ta.ema(close, 21)
ema50 = ta.ema(close, 50)

// Detect crossovers
bullishCross = ta.crossover(ema21, ema50)
bearishCross = ta.crossunder(ema21, ema50)

// Plot the EMAs
plot(ema21, color=color.green, linewidth=2, title="EMA 21")
plot(ema50, color=color.red, linewidth=2, title="EMA 50")

// Calculate tick size in points
var float tickSize = syminfo.mintick

// Calculate stop loss and take profit prices for long and short positions
longSL = close - slTicks * tickSize
longTP = close + tpTicks * tickSize

shortSL = close + slTicks * tickSize
shortTP = close - tpTicks * tickSize

// Execute trades on crossover signals
if (bullishCross)
    strategy.entry("Long", strategy.long)
    strategy.exit("Exit Long", "Long", stop=longSL, limit=longTP)

if (bearishCross)
    strategy.entry("Short", strategy.short)
    strategy.exit("Exit Short", "Short", stop=shortSL, limit=shortTP)

// Plot arrows on crossovers
plotshape(series=bullishCross, title="Buy Signal", location=location.belowbar, color=color.green, style=shape.labelup, text="BUY", size=size.small)
plotshape(series=bearishCross, title="Sell Signal", location=location.abovebar, color=color.red, style=shape.labeldown, text="SELL", size=size.small)

// Optional: Background coloring
bgcolor(bullishCross ? color.new(color.green, 90) : na, title="Bullish Background")
bgcolor(bearishCross ? color.new(color.red, 90) : na, title="Bearish Background")
相关推荐