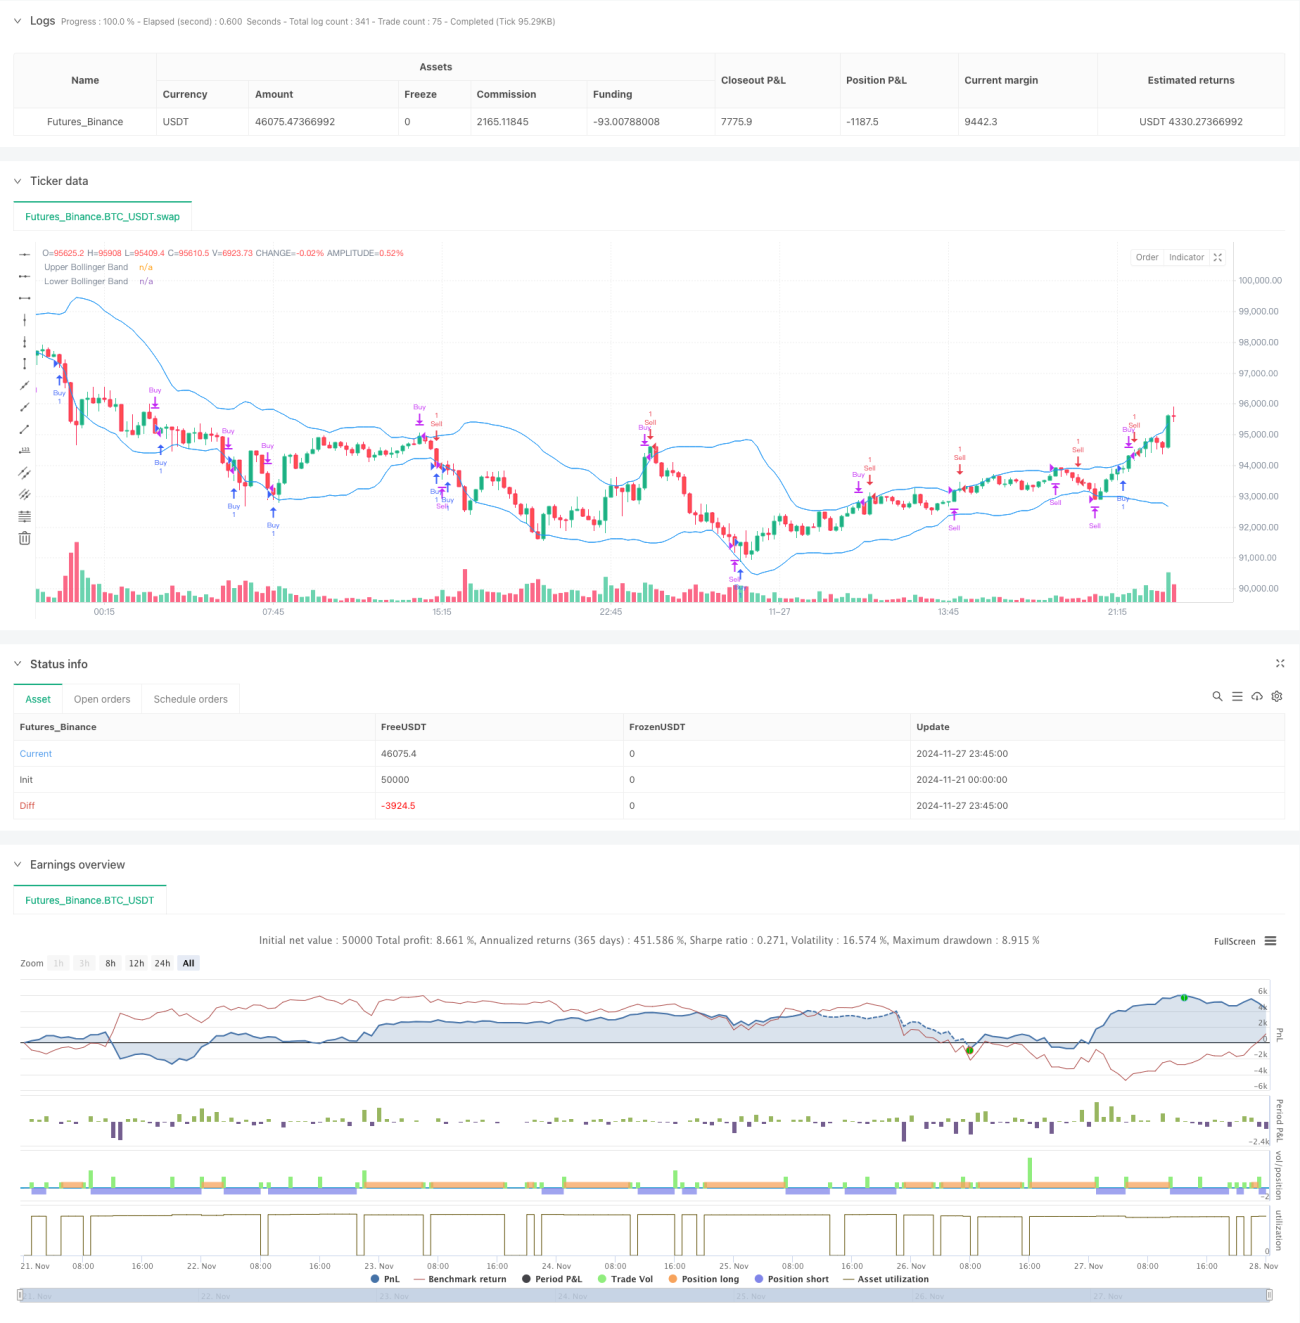
多重技术指标动态适应性交易策略(MTDAT)

MACD RSI BB ATR SMA SD
创建日期: 2024-11-29 14:54:57 最后修改: 2024-11-29 14:54:57
复制: 0 点击次数: 157
avatar of ChaoZhang ChaoZhang
1
关注
1239
关注者

多重技术指标动态适应性交易策略(MTDAT)

概述

该策略是一个基于多重技术指标的综合交易系统,通过结合MACD、RSI、布林带和ATR等多个技术指标,实现对市场趋势和反转机会的捕捉。策略采用动态止损和获利方案,能够根据市场波动性自适应调整交易参数,在保证收益的同时有效控制风险。回测结果显示,该策略在过去三个月的测试期间实现了676.27%的收益率,展现出良好的市场适应性。

策略原理

策略采用多层技术指标验证系统,包括: 1. MACD(12,26,9)用于捕捉动量转换信号,当MACD线上穿信号线时产生买入信号,下穿时产生卖出信号 2. RSI(14)作为二级过滤器,在35以下视为超卖区域,65以上视为超买区域 3. 布林带(20,2)用于识别价格波动区间,当价格触及下轨时考虑买入,触及上轨时考虑卖出 4. ATR用于动态设置止损和获利水平,止损设为3倍ATR,获利目标设为5倍ATR

交易逻辑融合了趋势跟踪和反转交易两种策略,通过多重验证提高交易的准确性。系统会根据市场实时波动性自动调整止损和获利水平,实现风险管理的动态优化。

策略优势

  1. 多维度信号验证系统提高了交易的可靠性
  2. 动态止损获利方案适应不同市场环境
  3. 综合了趋势和反转两种交易思路,增加了交易机会
  4. 自动化的风险管理系统降低了人为判断错误
  5. 53.99%的胜率和1.44的利润因子显示策略具有稳定性
  6. 策略支持实时交易提醒,方便交易员操作

策略风险

  1. 多重指标可能导致信号滞后,在快速市场中错过机会
  2. 56.33%的最大回撤率需要较大的风险承受能力
  3. 交易频繁可能带来较高的交易成本
  4. 策略在剧烈波动市场中可能面临较大风险

风险控制建议: - 严格执行资金管理计划 - 定期检查和调整参数 - 在重要数据公布期间暂停交易 - 设置每日最大损失限制

策略优化方向

  1. 参数优化:

    • 考虑使用自适应周期的指标参数
    • 优化ATR倍数设置,提高风险收益比
  2. 信号系统改进:

    • 添加成交量指标验证
    • 引入市场情绪指标
  3. 风险管理优化:

    • 实现动态仓位管理
    • 增加时间过滤器
  4. 技术改进:

    • 添加市场波动率过滤器
    • 优化进出场时机判断

总结

该策略通过多重技术指标的组合和动态风险管理系统,实现了较好的交易效果。虽然存在一定的回撤风险,但通过严格的风险控制和持续优化,策略展现出良好的市场适应性和稳定性。建议交易者在使用该策略时,严格执行风险管理制度,并根据市场变化适时调整参数。

策略源码
/*backtest
start: 2024-11-21 00:00:00
end: 2024-11-28 00:00:00
period: 15m
basePeriod: 15m
exchanges: [{"eid":"Futures_Binance","currency":"BTC_USDT"}]
*/

//@version=5
strategy("XAUUSD STRATEGY 10MIN", overlay=true)

// Spread Adjustment (38-point spread)
spread = 38 * syminfo.mintick       

// MACD Calculation
[macdLine, signalLine, _] = ta.macd(close, 12, 26, 9)
macdBuy = ta.crossover(macdLine, signalLine)
macdSell = ta.crossunder(macdLine, signalLine)

// RSI Calculation
rsi = ta.rsi(close, 14)
rsiOverbought = rsi > 65
rsiOversold = rsi < 35

// Bollinger Bands Calculation
basis = ta.sma(close, 20)
dev = 2 * ta.stdev(close, 20)
upperBand = basis + dev
lowerBand = basis - dev

// ATR Calculation for Volatility-Based Stop Loss and Take Profit
atr = ta.atr(14)
stopLoss = 3 * atr
takeProfit = 5 * atr

// Variables to track entry price and line
var line entryLine = na
var int tradeNumber = 0
var string tradeType = ""
var string tradeSignalComment = ""

// Buy Condition
buyCondition = (macdBuy or rsiOversold or close < lowerBand)

// Sell Condition
sellCondition = (macdSell or rsiOverbought or close > upperBand)

// Strategy Entry and Alerts
if (buyCondition and strategy.opentrades == 0)  // Open a new buy trade
    // Remove the previous entry line if it exists
    // if not na(entryLine)
    //     line.delete(entryLine)
    
    // Adjust the entry price by adding the spread (ask price)
    buyPrice = close + spread

    // Enter a new buy trade at the ask price, and close it with the bid price
    strategy.entry("Buy", strategy.long, stop=buyPrice - stopLoss, limit=buyPrice + takeProfit, comment="Enter buy $" + str.tostring(buyPrice))
    tradeNumber := tradeNumber + 1  // Increment trade number
    tradeType := "Entry Long"
    tradeSignalComment := "Enter buy trade"
    
    // Plot new dotted entry line for the current trade
    // entryLine := line.new(bar_index, buyPrice, bar_index + 50, buyPrice, width=1, color=color.green, style=line.style_dotted)
    
    // Send alert for the buy entry
    alert("Trade No: " + str.tostring(tradeNumber) + "\n" +
          "Signal: " + tradeType + " - " + tradeSignalComment + "\n" +
          "Date/Time: " + str.format("{0,date,dd-MM-yyyy HH:mm}", time) + "\n" +
          "Price: " + str.tostring(buyPrice), alert.freq_once_per_bar_close)

if (sellCondition and strategy.opentrades == 0)  // Open a new sell trade
    // Remove the previous entry line if it exists
    // if not na(entryLine)
    //     line.delete(entryLine)
    
    // Adjust the entry price by subtracting the spread (bid price)
    sellPrice = close - spread

    // Enter a new sell trade at the bid price, and close it with the ask price
    strategy.entry("Sell", strategy.short, stop=sellPrice + stopLoss, limit=sellPrice - takeProfit, comment="Enter sell $" + str.tostring(sellPrice))
    tradeNumber := tradeNumber + 1  // Increment trade number
    tradeType := "Entry Short"
    tradeSignalComment := "Enter sell trade"
    
    // Plot new dotted entry line for the current trade
    // entryLine := line.new(bar_index, sellPrice, bar_index + 50, sellPrice, width=1, color=color.red, style=line.style_dotted)
    
    // Send alert for the sell entry
    alert("Trade No: " + str.tostring(tradeNumber) + "\n" +
          "Signal: " + tradeType + " - " + tradeSignalComment + "\n" +
          "Date/Time: " + str.format("{0,date,dd-MM-yyyy HH:mm}", time) + "\n" +
          "Price: " + str.tostring(sellPrice), alert.freq_once_per_bar_close)

// Exit conditions and alerts
if (strategy.position_size > 0 and sellCondition)  // Close buy when sell conditions met
    // Adjust the exit price by subtracting the spread (bid price)
    exitPrice = close - spread
    strategy.close("Buy", comment="Exit buy $" + str.tostring(exitPrice))
    
    // Remove the entry line when the trade is closed
    // if not na(entryLine)
    //     line.delete(entryLine)
    
    // Send alert for the buy exit
    tradeType := "Exit Long"
    tradeSignalComment := "Exit buy trade"
    alert("Trade No: " + str.tostring(tradeNumber) + "\n" +
          "Signal: " + tradeType + " - "  + tradeSignalComment + "\n" +
          "Date/Time: " + str.format("{0,date,dd-MM-yyyy HH:mm}", time) + "\n" +
          "Price: " + str.tostring(exitPrice), alert.freq_once_per_bar_close)

if (strategy.position_size < 0 and buyCondition)  // Close sell when buy conditions met
    // Adjust the exit price by adding the spread (ask price)
    exitPrice = close + spread
    strategy.close("Sell", comment="Exit sell $" + str.tostring(exitPrice))
    
    // Remove the entry line when the trade is closed
    // if not na(entryLine)
    //     line.delete(entryLine)
    
    // Send alert for the sell exit
    tradeType := "Exit Short"
    tradeSignalComment := "Exit sell trade"
    alert("Trade No: " + str.tostring(tradeNumber) + "\n" +
          "Signal: " + tradeType + " - " + tradeSignalComment + "\n" +
          "Date/Time: " + str.format("{0,date,dd-MM-yyyy HH:mm}", time) + "\n" +
          "Price: " + str.tostring(exitPrice), alert.freq_once_per_bar_close)

// Plot Indicators
plot(upperBand, title="Upper Bollinger Band", color=color.blue)
plot(lowerBand, title="Lower Bollinger Band", color=color.blue)
相关推荐