Double Smoothed Moving Average Trend Following Strategy - Based on Modified Heikin-Ashi

Overview
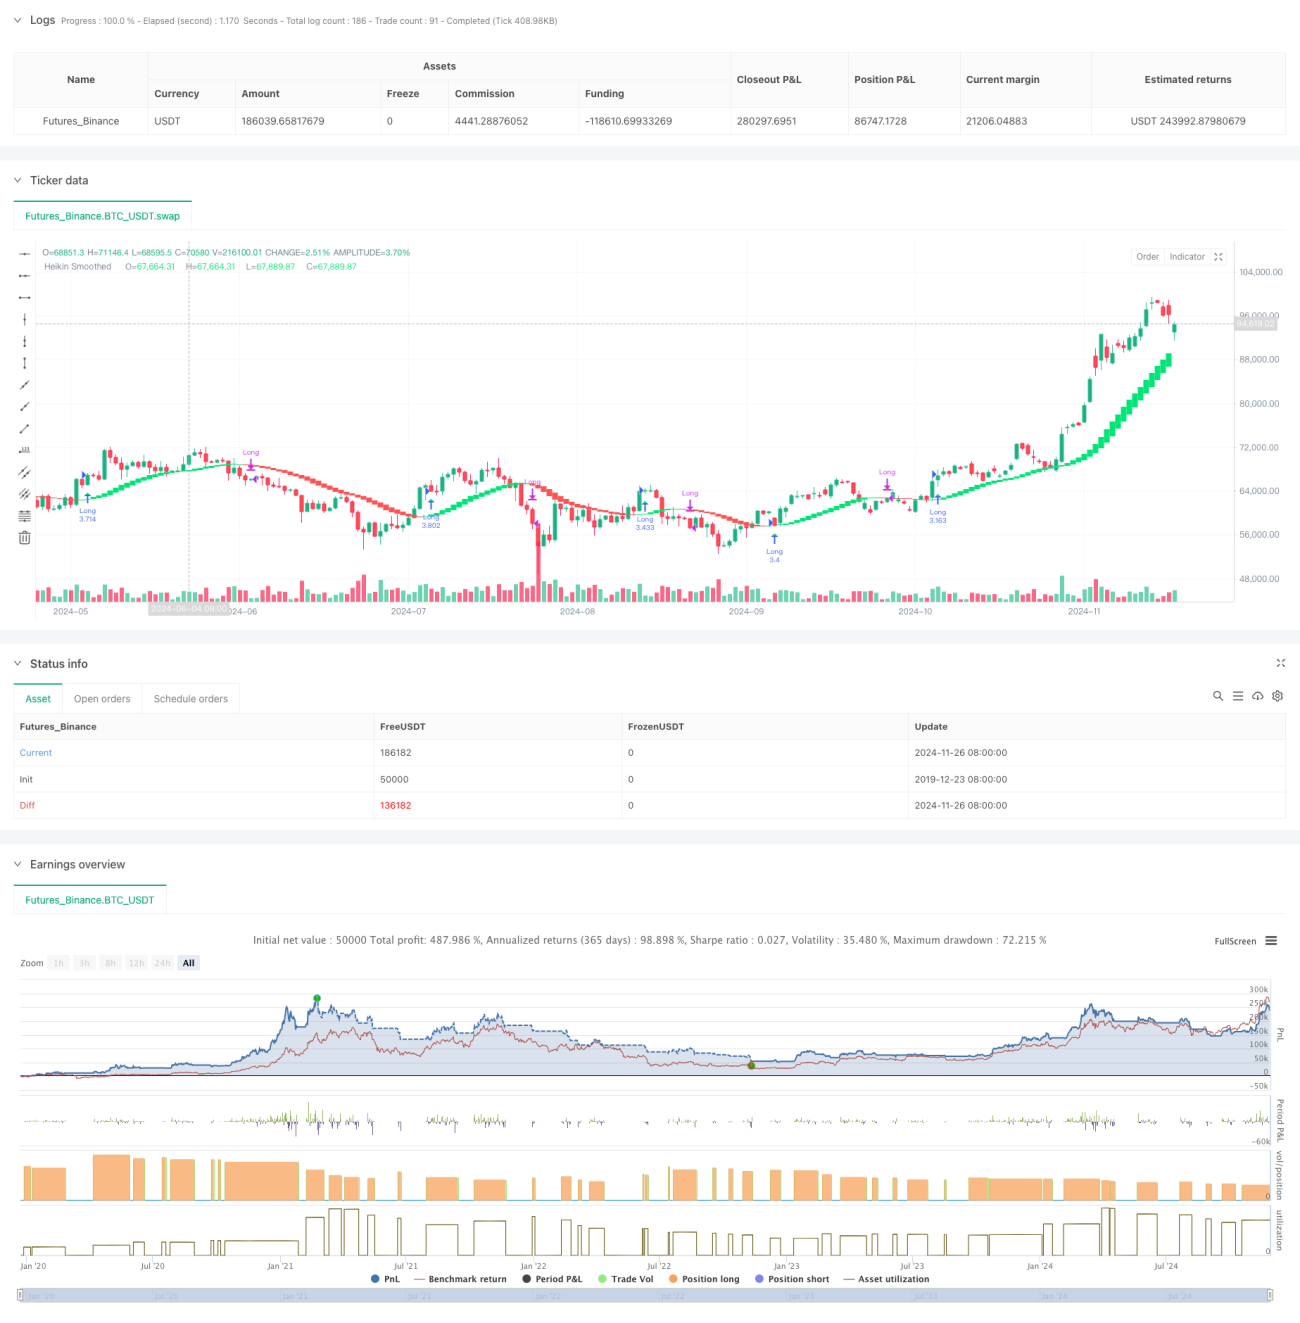
This strategy is a trend following system based on modified Heikin-Ashi candlesticks. By applying double Exponential Moving Average (EMA) smoothing to traditional Heikin-Ashi candlesticks, it effectively reduces market noise and provides clearer trend signals. The strategy operates in a long-only mode, holding positions during uptrends and staying out of the market during downtrends, capturing market returns through efficient trend detection.
Strategy Principles
The core logic includes the following key steps:
- Initial EMA smoothing of OHLC price data
- Calculation of modified Heikin-Ashi candlesticks using smoothed prices
- Secondary EMA smoothing of the calculated Heikin-Ashi candlesticks
- Color change determination through comparison of smoothed open and close prices
- Generation of buy signals when candles change from red to green, and sell signals when changing from green to red
- Trading with 100% of account equity position sizing
Strategy Advantages
- Double smoothing significantly reduces false signals
- Long-only approach eliminates short-selling risks
- Entry after trend confirmation improves win rate
- Complete signal system supports automated trading
- Flexible timeframe selection meets different trading needs
- Simple and clear entry/exit rules facilitate execution
- Supports money management under different market conditions
Strategy Risks
- Potential large drawdowns during trend reversals
- Multiple false signals possible in ranging markets
- Full position trading increases capital risk
- Delayed entry signals may miss initial price movements
- Performance varies significantly across different timeframes
Strategy Optimization Directions
- Introduce trend strength filters to reduce false signals in ranging markets
- Implement dynamic position sizing to optimize capital utilization
- Add trailing stop loss functionality to control drawdown risk
- Incorporate additional technical indicators for signal confirmation
- Develop adaptive parameter system to improve strategy stability
Summary
The strategy builds a robust trend following system using double smoothing and modified Heikin-Ashi candlesticks as its core components. The strategy design is clean and straightforward, easy to understand and execute, while providing multiple optimization directions to adapt to different market environments. Although it has certain lag and drawdown risks, through proper money management and risk control measures, this strategy can provide investors with a reliable trend following tool.
/*backtest
start: 2019-12-23 08:00:00
end: 2024-11-27 08:00:00
period: 1d
basePeriod: 1d
exchanges: [{"eid":"Futures_Binance","currency":"BTC_USDT"}]
*/

//@version=5
strategy("Smoothed Heiken Ashi Strategy Long Only", overlay=true, initial_capital=1000, default_qty_type=strategy.percent_of_equity, default_qty_value=100)

len = input.int(10, title="EMA Length")- 1