概述
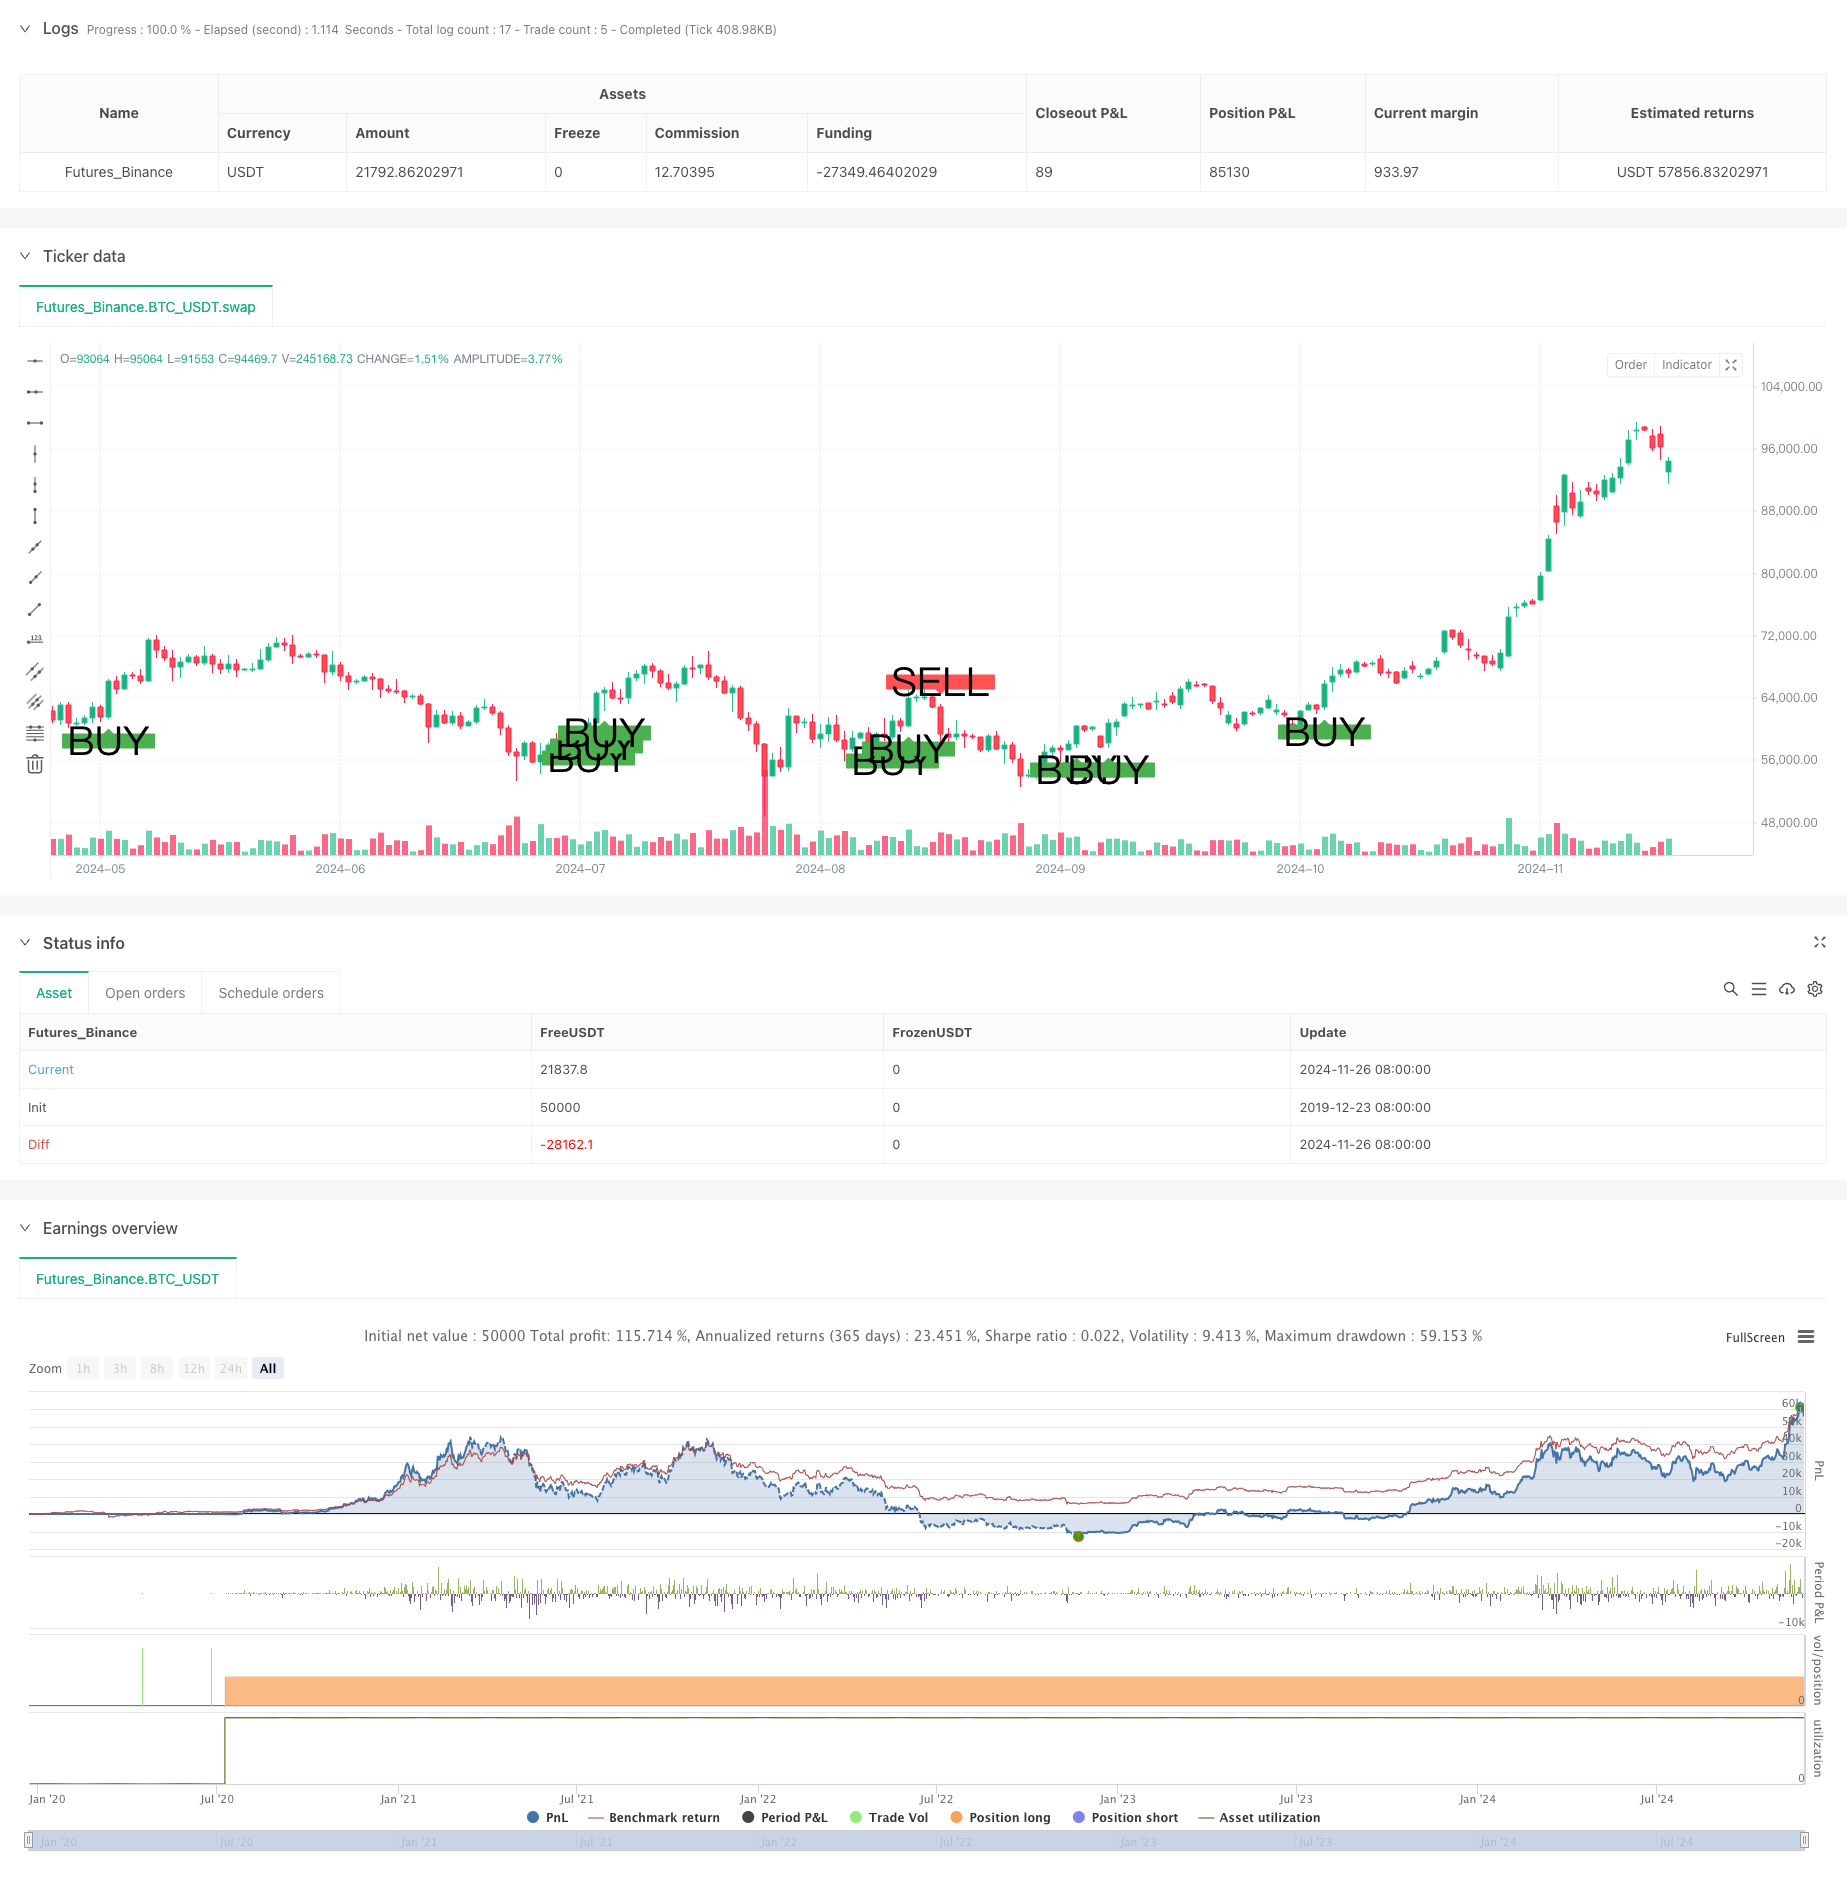
这是一个结合了多重均线、趋势跟踪、结构突破和动量指标的综合性交易策略。该策略通过分析多个时间周期的趋势方向,同时结合价格结构突破和回调买入的方式来确定交易信号。策略采用了固定的止损和获利目标来管理风险,并通过多重验证机制来提高交易的准确性。
策略原理
策略使用了三条指数移动平均线(EMA25、EMA50和EMA200)来确定市场趋势。当价格位于EMA200之上且EMA200向上倾斜时,被认为处于上升趋势;反之则视为下降趋势。在确定趋势方向后,策略寻找价格对EMA25或EMA50的回调机会。同时,策略还需要确认近期高点或低点的突破,以及K线收盘价相对开盘价的位置,以验证动量的方向。RSI指标作为额外的过滤条件,要求买入信号RSI大于50,卖出信号RSI小于50。
策略优势
- 多重验证机制显著提高了交易的可靠性
- 结合了趋势和动量分析,降低了假突破的风险
- 清晰的止损和获利目标有助于情绪管理
- 策略逻辑简单清晰,易于理解和执行
- 适用于不同的市场环境和交易品种
策略风险
- 多重条件可能导致错过部分交易机会
- 固定的止损和获利目标可能不适合所有市场环境
- 在剧烈波动的市场中可能触发频繁的止损
- 需要持续监控市场以确保策略参数的适用性
- 在横盘市场中可能产生较多假信号
策略优化方向
- 引入自适应的止损和获利目标计算方法
- 增加交易量分析作为辅助确认指标
- 考虑加入市场波动率过滤机制
- 优化趋势判断的时间周期选择
- 增加策略在不同市场环境下的适应性
总结
这是一个设计合理的综合性交易策略,通过多重技术指标的配合使用,有效地平衡了交易机会和风险控制。策略的核心优势在于其严格的多重验证机制,这有助于提高交易的成功率。虽然存在一些需要优化的地方,但总体而言,这是一个值得尝试的策略框架。
策略源码
/*backtest
start: 2019-12-23 08:00:00
end: 2024-11-27 08:00:00
period: 1d
basePeriod: 1d
exchanges: [{"eid":"Futures_Binance","currency":"BTC_USDT"}]
*/

//@version=5
strategy("Custom Buy/Sell Strategy", overlay=true)

// Input parameters
ema25 = ta.ema(close, 25)
ema50 = ta.ema(close, 50)
ema200 = ta.ema(close, 200)
rsi = ta.rsi(close, 14)
sl_pips = 10
tp_pips = 15

// Convert pips to price units
sl_price_units = sl_pips * syminfo.pointvalue
tp_price_units = tp_pips * syminfo.pointvalue

// Define conditions for buy and sell signals
uptrend_condition = ema200 < close and ta.rising(ema200, 1)
downtrend_condition = ema200 > close and ta.falling(ema200, 1)

pullback_to_ema25 = low <= ema25
pullback_to_ema50 = low <= ema50
pullback_condition = pullback_to_ema25 or pullback_to_ema50

break_of_structure = high > ta.highest(high, 5)[1]
candle_imbalance = close > open

buy_condition = uptrend_condition and pullback_condition and rsi > 50 and break_of_structure and candle_imbalance

pullback_to_ema25_sell = high >= ema25
pullback_to_ema50_sell = high >= ema50
pullback_condition_sell = pullback_to_ema25_sell or pullback_to_ema50_sell

break_of_structure_sell = low < ta.lowest(low, 5)[1]
candle_imbalance_sell = close < open

sell_condition = downtrend_condition and pullback_condition_sell and rsi < 50 and break_of_structure_sell and candle_imbalance_sell

// Plot signals on the chart
plotshape(series=buy_condition, location=location.belowbar, color=color.green, style=shape.labelup, text="BUY", size=size.large)
plotshape(series=sell_condition, location=location.abovebar, color=color.red, style=shape.labeldown, text="SELL", size=size.large)

// Calculate stop loss and take profit levels for buy signals
var float buy_sl = na
var float buy_tp = na

if buy_condition and strategy.position_size == 0
    buy_sl := close - sl_price_units
    buy_tp := close + tp_price_units
    strategy.entry("Buy", strategy.long)
    strategy.exit("TP/SL Buy", from_entry="Buy", limit=buy_tp, stop=buy_sl)
    label.new(bar_index, high, text="Entry: " + str.tostring(close) + "\nSL: " + str.tostring(buy_sl) + "\nTP: " + str.tostring(buy_tp), style=label.style_label_up, color=color.green, textcolor=color.white, size=size.small)

// Calculate stop loss and take profit levels for sell signals
var float sell_sl = na
var float sell_tp = na

if sell_condition and strategy.position_size == 0
    sell_sl := close + sl_price_units
    sell_tp := close - tp_price_units
    strategy.entry("Sell", strategy.short)
    strategy.exit("TP/SL Sell", from_entry="Sell", limit=sell_tp, stop=sell_sl)
    label.new(bar_index, low, text="Entry: " + str.tostring(close) + "\nSL: " + str.tostring(sell_sl) + "\nTP: " + str.tostring(sell_tp), style=label.style_label_down, color=color.red, textcolor=color.white, size=size.small)

// // Plot stop loss and take profit levels for buy signals
// if not na(buy_sl)
//     line.new(x1=bar_index, y1=buy_sl, x2=bar_index + 1, y2=buy_sl, color=color.red, width=1)
// if not na(buy_tp)
//     line.new(x1=bar_index, y1=buy_tp, x2=bar_index + 1, y2=buy_tp, color=color.green, width=1)

// // Plot stop loss and take profit levels for sell signals
// if not na(sell_sl)
//     line.new(x1=bar_index, y1=sell_sl, x2=bar_index + 1, y2=sell_sl, color=color.red, width=1)
// if not na(sell_tp)
//     line.new(x1=bar_index, y1=sell_tp, x2=bar_index + 1, y2=sell_tp, color=color.green, width=1)
相关推荐