
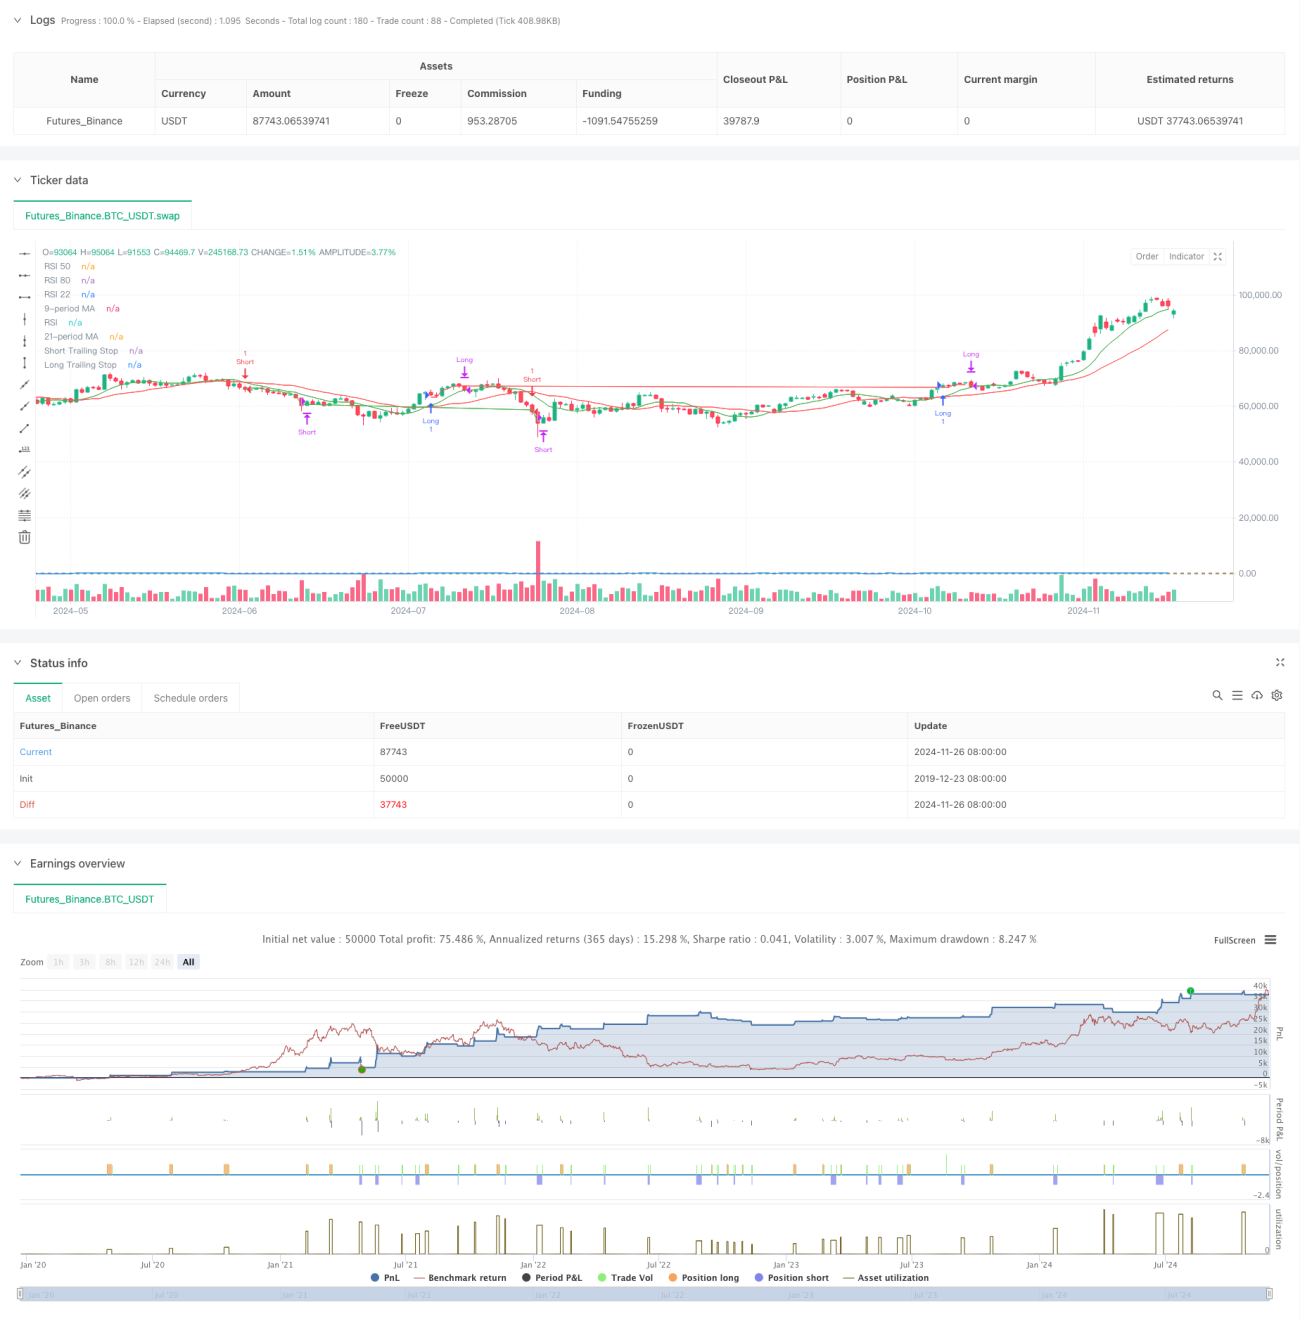
Overview
This strategy is a quantitative trading system that combines Moving Average crossover with the Relative Strength Index (RSI), integrated with a trailing stop loss function. The strategy utilizes two moving averages - 9-period and 21-period - as primary trend indicators, coupled with RSI for trade signal confirmation, and implements dynamic trailing stops for profit protection and risk control. The strategy design comprehensively considers market trends, momentum, and risk management dimensions to form a complete trading system.
Strategy Principles
The core logic of the strategy is based on the following key elements:
- Trend Identification: Recognizes market trend changes through crossovers of fast (9-period) and slow (21-period) moving averages. Long signals are generated when the fast MA crosses above the slow MA with RSI above 55, while short signals occur when the fast MA crosses below with RSI below 45.
- Signal Confirmation: Uses RSI as a signal filter, enhancing trade signal reliability through RSI threshold settings.
- Risk Control: Employs a 1% trailing stop loss, dynamically adjusting stop positions to protect profits. Also includes RSI-based profit-taking conditions, closing long positions when RSI exceeds 80 and short positions when RSI falls below 22.
- Stop Loss Mechanism: Combines fixed and trailing stops, automatically closing positions when price breaches preset percentage levels from entry points or hits trailing stop levels.
Strategy Advantages
- Multi-dimensional Signal Verification: Improves trading signal accuracy through dual confirmation of MA crossover and RSI.
- Comprehensive Risk Management: Implements dynamic trailing stops for both profit protection and risk control.
- Flexible Entry Mechanism: Effectively captures market turning points by combining trend and momentum indicators.
- High Automation Level: Clear strategy logic facilitates automated trading implementation.
- Strong Adaptability: Can be adapted to different market environments through parameter adjustment.
Strategy Risks
- Sideways Market Risk: May generate frequent false breakout signals in range-bound markets.
- Slippage Risk: Potential slippage losses during trailing stop execution.
- Parameter Sensitivity: Strategy performance significantly affected by MA period and RSI threshold settings.
- Systemic Risk: Stop losses may not execute timely in extreme market conditions.
Strategy Optimization Directions
- Signal Enhancement: Consider incorporating volume indicators as additional confirmation conditions.
- Stop Loss Refinement: Implement volatility-based dynamic stop loss adjustment mechanisms.
- Position Management: Add dynamic position sizing system based on risk assessment.
- Market Adaptability: Include market environment recognition mechanism for different parameter settings in various market states.
- Signal Filtering: Add time filters to avoid trading during volatile market opening and closing periods.
Summary
This strategy constructs a trading system combining trend-following and momentum characteristics through classic technical analysis indicators. Its core strengths lie in multi-dimensional signal confirmation mechanisms and comprehensive risk management systems. Through continuous optimization and improvement, the strategy shows promise for maintaining stable performance across different market environments. Traders are advised to conduct thorough backtesting before live implementation and adjust parameters according to specific trading instrument characteristics.
- 1