概述
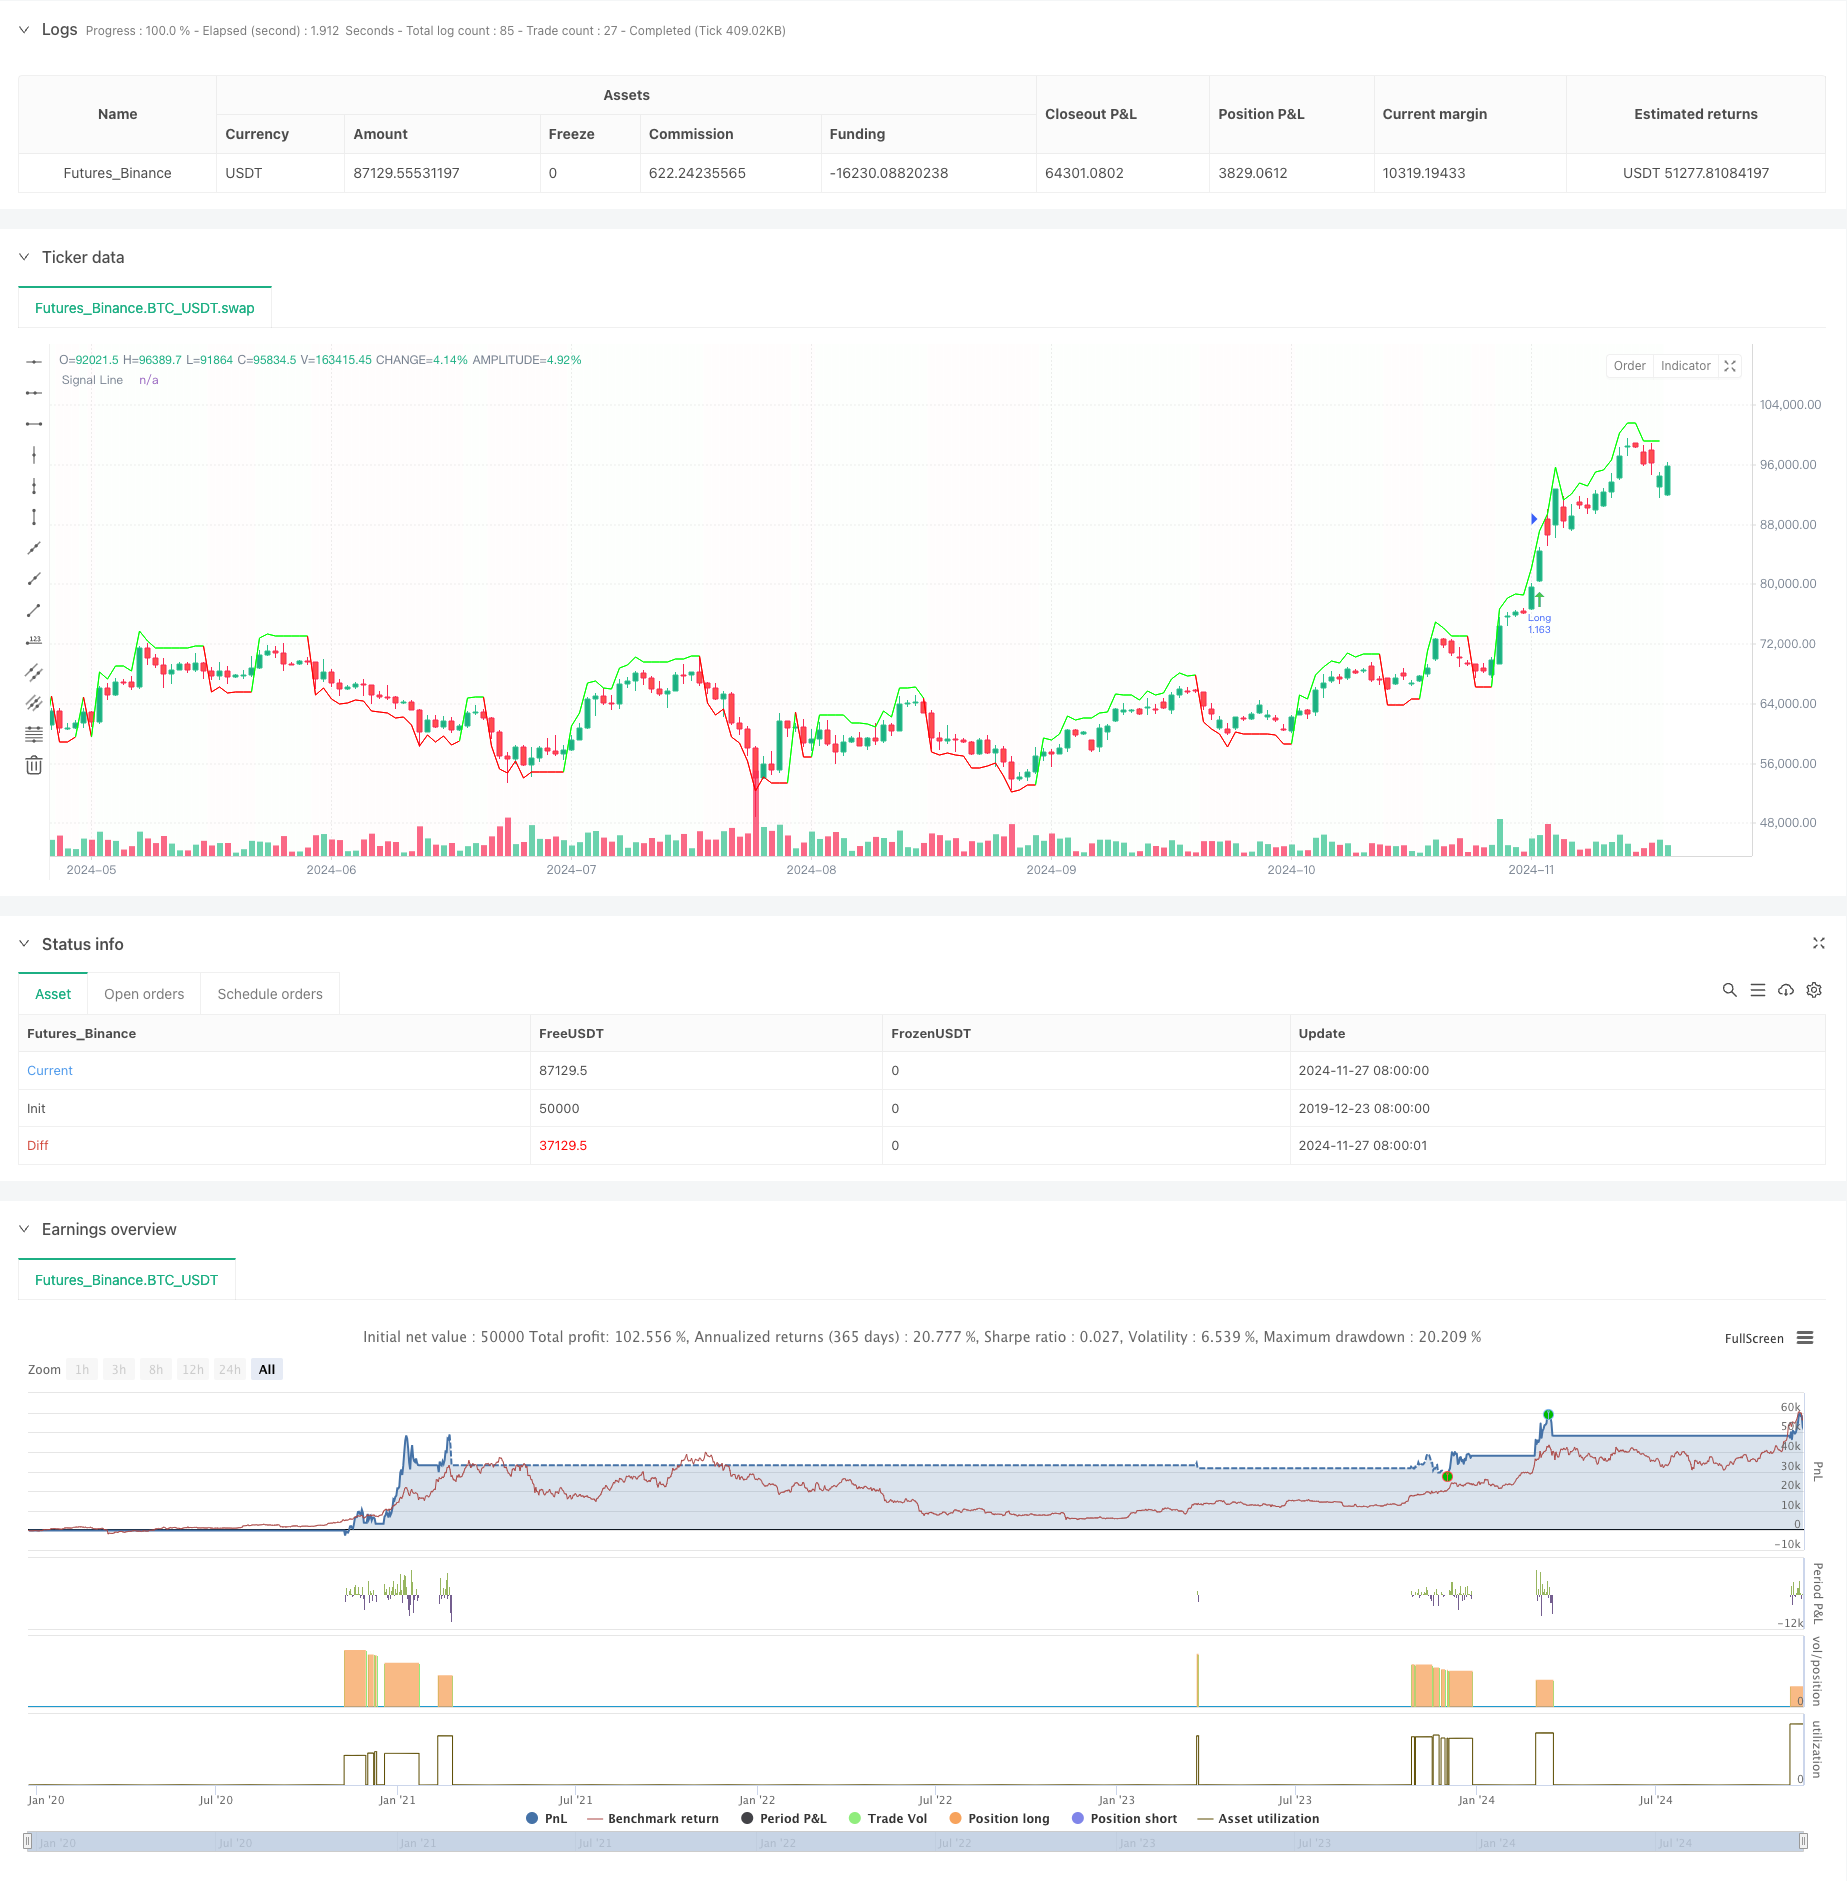
该策略是一个基于多时间框架分析的交易系统,结合了Bollinger带、Hull移动平均线和加权移动平均线进行交易信号的生成。策略主要在1小时时间框架上运行,同时整合了5分钟、1小时和3小时三个时间周期的市场数据,通过多重技术指标的配合来确认交易机会。策略采用动态的止盈止损机制,并根据账户权益自动调整仓位大小,实现风险的有效控制。
策略原理
策略的核心逻辑基于多重技术指标的交叉确认。在多个时间周期上同时监控价格与各类均线的关系,包括5分钟周期的加权移动平均线(VWMA)、1小时周期的加权移动平均线和3小时周期的Hull移动平均线(HMA)。当价格在所有时间周期的指标之上时,系统会在价格突破上轨时产生做多信号;相反,当价格位于所有指标之下时,系统会在价格突破下轨时产生做空信号。策略还引入了偏差值计算(deviation),用于设定动态的入场和出场阈值,提高交易的灵活性。
策略优势
- 多重时间周期分析降低了假突破的风险,提高了交易信号的可靠性
- 动态的止盈止损设置能够适应不同市场环境
- 基于账户权益的仓位管理确保了资金使用的合理性
- 多种出场机制的选择增加了策略的适应性
- 图形化界面提供清晰的交易信号展示,便于分析和判断
- 整合了多个成熟的技术指标,提高了交易决策的准确性
策略风险
- 多重指标的使用可能导致交易信号滞后
- 在震荡市场中可能产生频繁的假突破信号
- 固定的止盈止损比例可能不适合所有市场环境
- 多时间周期的数据处理可能增加策略运行的复杂度
- 在高波动性市场中可能面临较大的滑点风险
策略优化方向
- 引入波动率指标来动态调整止盈止损水平
- 增加市场环境识别功能,在不同市场状态下使用不同的参数设置
- 优化信号过滤机制,减少假突破带来的损失
- 加入交易量分析,提高突破信号的可靠性
- 开发自适应的参数优化机制,提高策略的稳定性
总结
该策略通过多时间周期分析和多重技术指标的结合,构建了一个相对完整的交易系统。策略的优势在于信号的可靠性和风险管理的有效性,但同时也存在信号滞后和参数优化等问题。通过持续的优化和改进,策略有望在不同市场环境下保持稳定的表现。
策略源码
/*backtest
start: 2019-12-23 08:00:00
end: 2024-11-28 00:00:00
period: 1d
basePeriod: 1d
exchanges: [{"eid":"Futures_Binance","currency":"BTC_USDT"}]
*/

//@version=5
strategy("1H- 280, 2.7", overlay=true)


// Fetch the indicator values from different timeframes
vwma5 = request.security(syminfo.tickerid, "5", ta.wma(close, 233), lookahead = barmerge.lookahead_off)
vwma_hourly = request.security(syminfo.tickerid, "60", ta.wma(close, 89), lookahead = barmerge.lookahead_off)
hullma155_3h = request.security(syminfo.tickerid, "180", ta.hma(close, 155), lookahead = barmerge.lookahead_off)


// Calculate the deviation value
deviation = close * 0.032


// Initialize the signal variables
var float signalLine = na
var color lineColor = na


// Long Entry Conditions
longCondition_5min = close > vwma5
longCondition_hourly = close > vwma_hourly
longCondition_3h = close > hullma155_3h


// Short Entry Conditions
shortCondition_5min = close < vwma5
shortCondition_hourly = close < vwma_hourly
shortCondition_3h = close < hullma155_3h


// Long Entry
if longCondition_5min and longCondition_hourly and longCondition_3h
    signalLine := close + deviation
    lineColor := color.rgb(0, 255, 0, 1)


// Short Entry
if shortCondition_5min and shortCondition_hourly and shortCondition_3h
    signalLine := close - deviation
    lineColor := color.rgb(255, 0, 0, 1)


// Plotting the connecting line
plot(signalLine, title="Signal Line", color=lineColor, linewidth=1, style=plot.style_line)


// Colorize the signal line
bgcolor(signalLine > close ? color.rgb(0, 255, 0, 99) : color.rgb(255, 0, 0, 99), transp=90)


// Strategy settings
useTPSL = input(true, "Use TP/SL for closing long positions?")
useDownbreakOutbreak = input(false, "Use Downbreak and Outbreak for closing positions?")
useM7FClosing = input(false, "Use M7F Signal for closing positions?")


length1 = input.int(280, minval=1)
src = input(close, title="Source")
mult = input.float(2.7, minval=0.001, maxval=50, title="StdDev")


basis = ta.vwma(src, length1)
dev = mult * ta.stdev(src, length1)
upper = basis + dev
lower = basis - dev


offset = input.int(0, "Offset", minval = -500, maxval = 500)


length2 = input.int(55, minval=1)
src2 = input(close, title="Source")
hullma = ta.wma(2 * ta.wma(src2, length2 / 2) - ta.wma(src2, length2), math.floor(math.sqrt(length2)))


hullmacrosslower = ta.crossover(hullma, lower)
hullmacrossupper = ta.crossunder(hullma, upper)


breakout = ta.crossover(ohlc4, upper)
breakdown = ta.crossunder(ohlc4, upper)
outbreak = ta.crossover(ohlc4, lower)
downbreak = ta.crossunder(ohlc4, lower)


// Calculate position size and leverage
margin_pct = 1
leverage = 1
position_size = strategy.equity * margin_pct
qty = position_size / close / leverage


// Define take profit and stop loss levels
take_profit = 0.14
stop_loss = 0.06


// Opening a long position
if breakout
    strategy.entry("Long", strategy.long, qty, limit=close*(1+take_profit), stop=close*(1-stop_loss))


// Opening a short position
if downbreak
    strategy.entry("Short", strategy.short, qty, limit=close*(1-take_profit), stop=close*(1+stop_loss))


// Closing positions based on chosen method
if useTPSL
    // Using TP/SL for closing long positions
    if strategy.position_size > 0 and breakdown
        strategy.close("Long", comment="Breakdown")
else if useDownbreakOutbreak
    // Using Downbreak and Outbreak for closing positions
    if strategy.position_size > 0 and (breakdown or downbreak)
        strategy.close("Long", comment="Breakdown")
    if strategy.position_size < 0 and (outbreak or downbreak)
        strategy.close("Short", comment="Outbreak")
else if useM7FClosing
    // Using M7F Signal for closing positions
    if strategy.position_size > 0 and (signalLine < close)
        strategy.close("Long", comment="M7F Signal")
    if strategy.position_size < 0 and (signalLine > close)
        strategy.close("Short", comment="M7F Signal")


// Plotting entry signals
plotshape(hullmacrosslower, title="High Bear Volatility", style=shape.arrowup, text="^^^^^", color=color.rgb(75, 202, 79), location=location.belowbar)
plotshape(hullmacrossupper, title="High Bull Volatility", style=shape.arrowdown, text="-----", color=color.rgb(215, 72, 72), location=location.abovebar)
plotshape(breakout ? 1 : na, title="Breakout", style=shape.arrowup, text="", color=color.rgb(75, 202, 79), location=location.belowbar, size=size.tiny)
plotshape(breakdown ? 1 : na, title="Breakdown", style=shape.arrowdown, text="", color=color.rgb(201, 71, 71), location=location.abovebar, size=size.tiny)
plotshape(outbreak ? 1 : na, title="Outbreak", style=shape.arrowup, text="", color=color.rgb(0, 110, 255), location=location.belowbar, size=size.tiny)
plotshape(downbreak ? 1 : na, title="Downbreak", style=shape.arrowdown, text="", color=color.rgb(255, 111, 0), location=location.abovebar, size=size.tiny)
相关推荐