Triangle Breakout with RSI Momentum Strategy

Overview
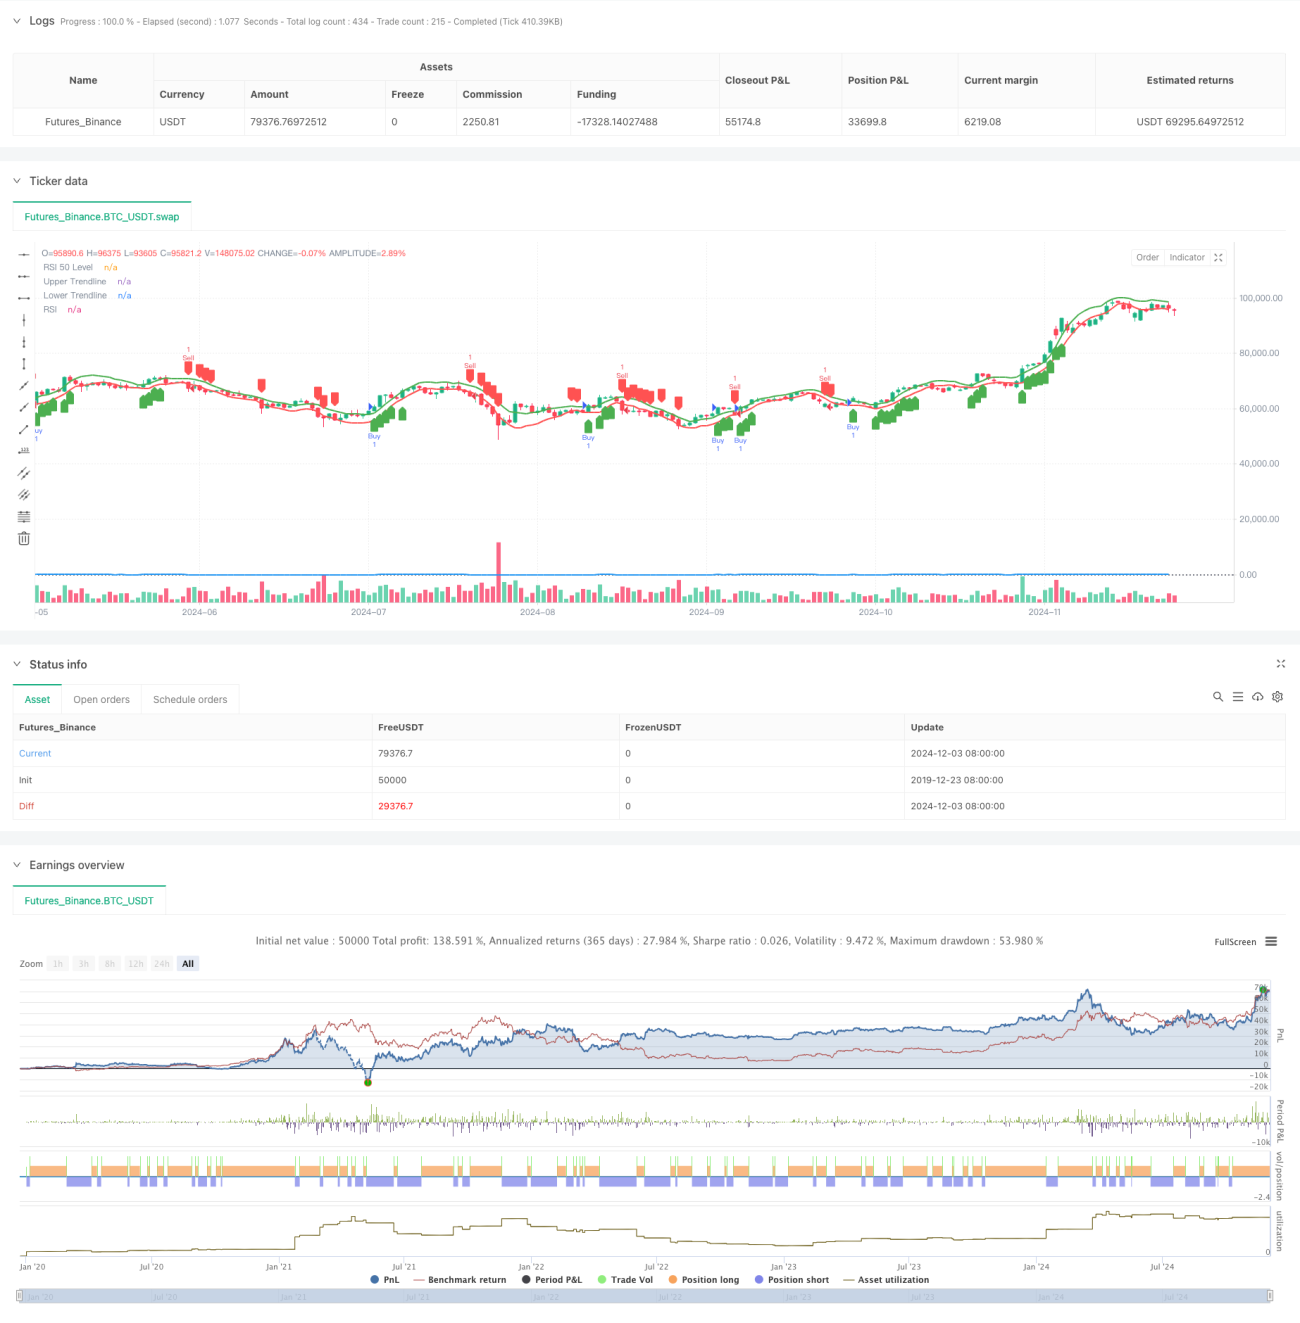
This strategy is a quantitative trading system that combines price pattern and technical indicators. It primarily identifies triangle pattern breakouts and confirms trades using RSI momentum. The strategy uses linear regression to construct upper and lower trendlines, determining trading signals through price breakouts and RSI positions, achieving an organic combination of pattern and momentum analysis.
Strategy Principle
The core logic consists of two main components: triangle pattern recognition and RSI momentum confirmation. First, it uses linear regression to calculate recent N-period highs and lows, constructing upper and lower trendlines to form a triangle. When price breaks above the upper trendline and RSI is above 50, it triggers a buy signal; when price breaks below the lower trendline and RSI is below 50, it triggers a sell signal. The strategy features adjustable parameters for triangle length and RSI period, providing strong adaptability.
Strategy Advantages
- Clear Structure: The strategy organically combines pattern analysis and momentum analysis, improving trading reliability through double confirmation.
- Flexible Parameters: Provides adjustable triangle length and RSI period parameters, facilitating optimization for different market characteristics.
- Strong Visualization: Clearly displays trendlines and trading signals on charts, facilitating strategy monitoring and backtesting analysis.
- Controlled Risk: Uses RSI as a filter to effectively reduce risks from false breakouts.
Strategy Risks
- May generate frequent trades in choppy markets, increasing transaction costs.
- Trendline calculations based on historical data may lag in rapidly volatile markets.
- RSI indicator may generate false signals under certain market conditions.
- Strategy lacks stop-loss mechanism, potentially bearing significant losses during extreme market volatility.
Strategy Optimization Directions
- Introduce Stop-Loss Mechanism: Recommend adding fixed or trailing stop-loss for risk control.
- Optimize Entry Timing: Consider adding volume confirmation to improve breakout signal reliability.
- Enhance Signal Filtering: Can add trend filters to avoid frequent trading in ranging markets.
- Dynamic Parameter Optimization: Suggest dynamically adjusting triangle length and RSI thresholds based on market volatility.
Conclusion
The Triangle Breakout with RSI Momentum Strategy is a complete and logically clear quantitative trading system. Through the dual confirmation mechanism of pattern and momentum, it effectively improves trading signal reliability. While certain risks exist, the strategy has good practical value through reasonable parameter optimization and risk control measures. Traders are advised to conduct thorough parameter optimization and backtesting verification based on specific market characteristics before live trading.
- 1