G-Channel and EMA Trend Filter Trading System

Overview
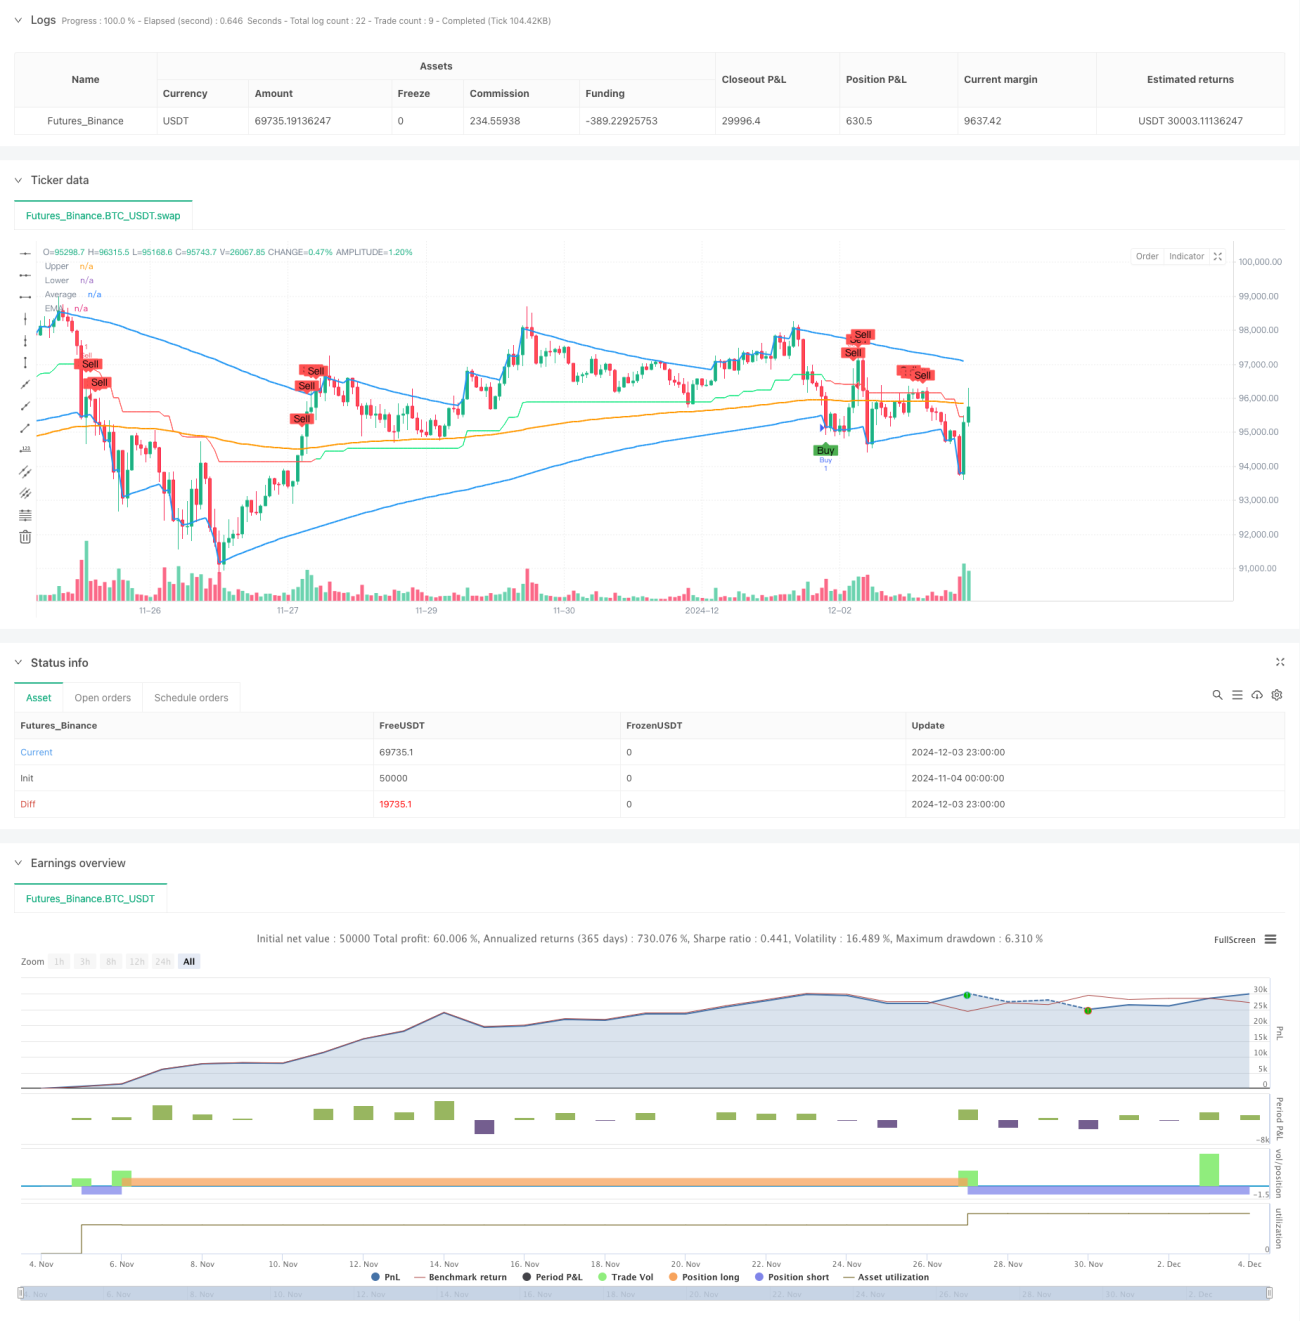
This strategy is a trend-following trading system based on the custom G-Channel and Exponential Moving Average (EMA). The G-Channel consists of upper (a), lower (b), and middle (avg) lines, determining channel boundaries through dynamic calculation of current and historical prices. The strategy combines EMA as a trend filter, generating trading signals through price crossovers with channel lines and relative position to EMA, effectively capturing market trend reversal points.
Strategy Principles
The core logic comprises two main components: G-Channel and EMA filter. The G-Channel calculations are based on current prices and historical data, dynamically adjusting channel width through an adaptive algorithm. The upper line (a) takes the maximum of current price and previous upper line, adjusted by channel width and length parameters; the lower line (b) uses a similar method for minimum values; the middle line is the arithmetic mean. Trading signals are triggered by combining price crossovers with channel lines and relative position to EMA: buy signals occur when price breaks above the lower line while below EMA; sell signals when price breaks below the upper line while above EMA.
Strategy Advantages
- Strong adaptability: G-Channel automatically adjusts channel width based on market volatility, adapting to different market environments.
- Trend confirmation: EMA as a filter improves trading signal reliability.
- Risk control: Dual verification mechanism through channel breakouts and trend confirmation reduces false signal risks.
- Clear signals: Trading conditions are clear, facilitating programmatic implementation and backtesting.
- Visual support: Strategy provides complete graphical display for analysis and judgment.
Strategy Risks
- Trend delay: EMA as a lagging indicator may cause delayed entry timing.
- Sideways market risk: May generate frequent false breakout signals in ranging markets.
- Parameter sensitivity: Channel length and EMA period choices significantly impact strategy performance.
- Market environment dependence: Strategy performs better in trending markets but may underperform in ranging markets.
Strategy Optimization Directions
- Introduce volatility indicators: Dynamically adjust channel parameters based on market volatility to improve adaptability.
- Add market environment filtering: Implement market state judgment mechanism to use different parameter settings in different market conditions.
- Optimize stop-loss mechanism: Design dynamic stop-loss plans based on channel width to enhance risk control.
- Improve signal filtering: Add volume, volatility, and other auxiliary indicators to improve signal quality.
- Parameter optimization: Optimize parameter combinations for different market environments through backtesting.
Summary
The G-Channel and EMA Trend Filter Trading System is a complete trading strategy combining channel breakouts and trend following. Through G-Channel's dynamic characteristics and EMA's trend confirmation function, the strategy effectively captures market turning points while controlling trading risks. Though certain limitations exist, the strategy's overall performance can be further improved through the proposed optimization directions. This strategy is suitable for trending markets and can serve as a foundation framework for building more complex trading systems.
- 1