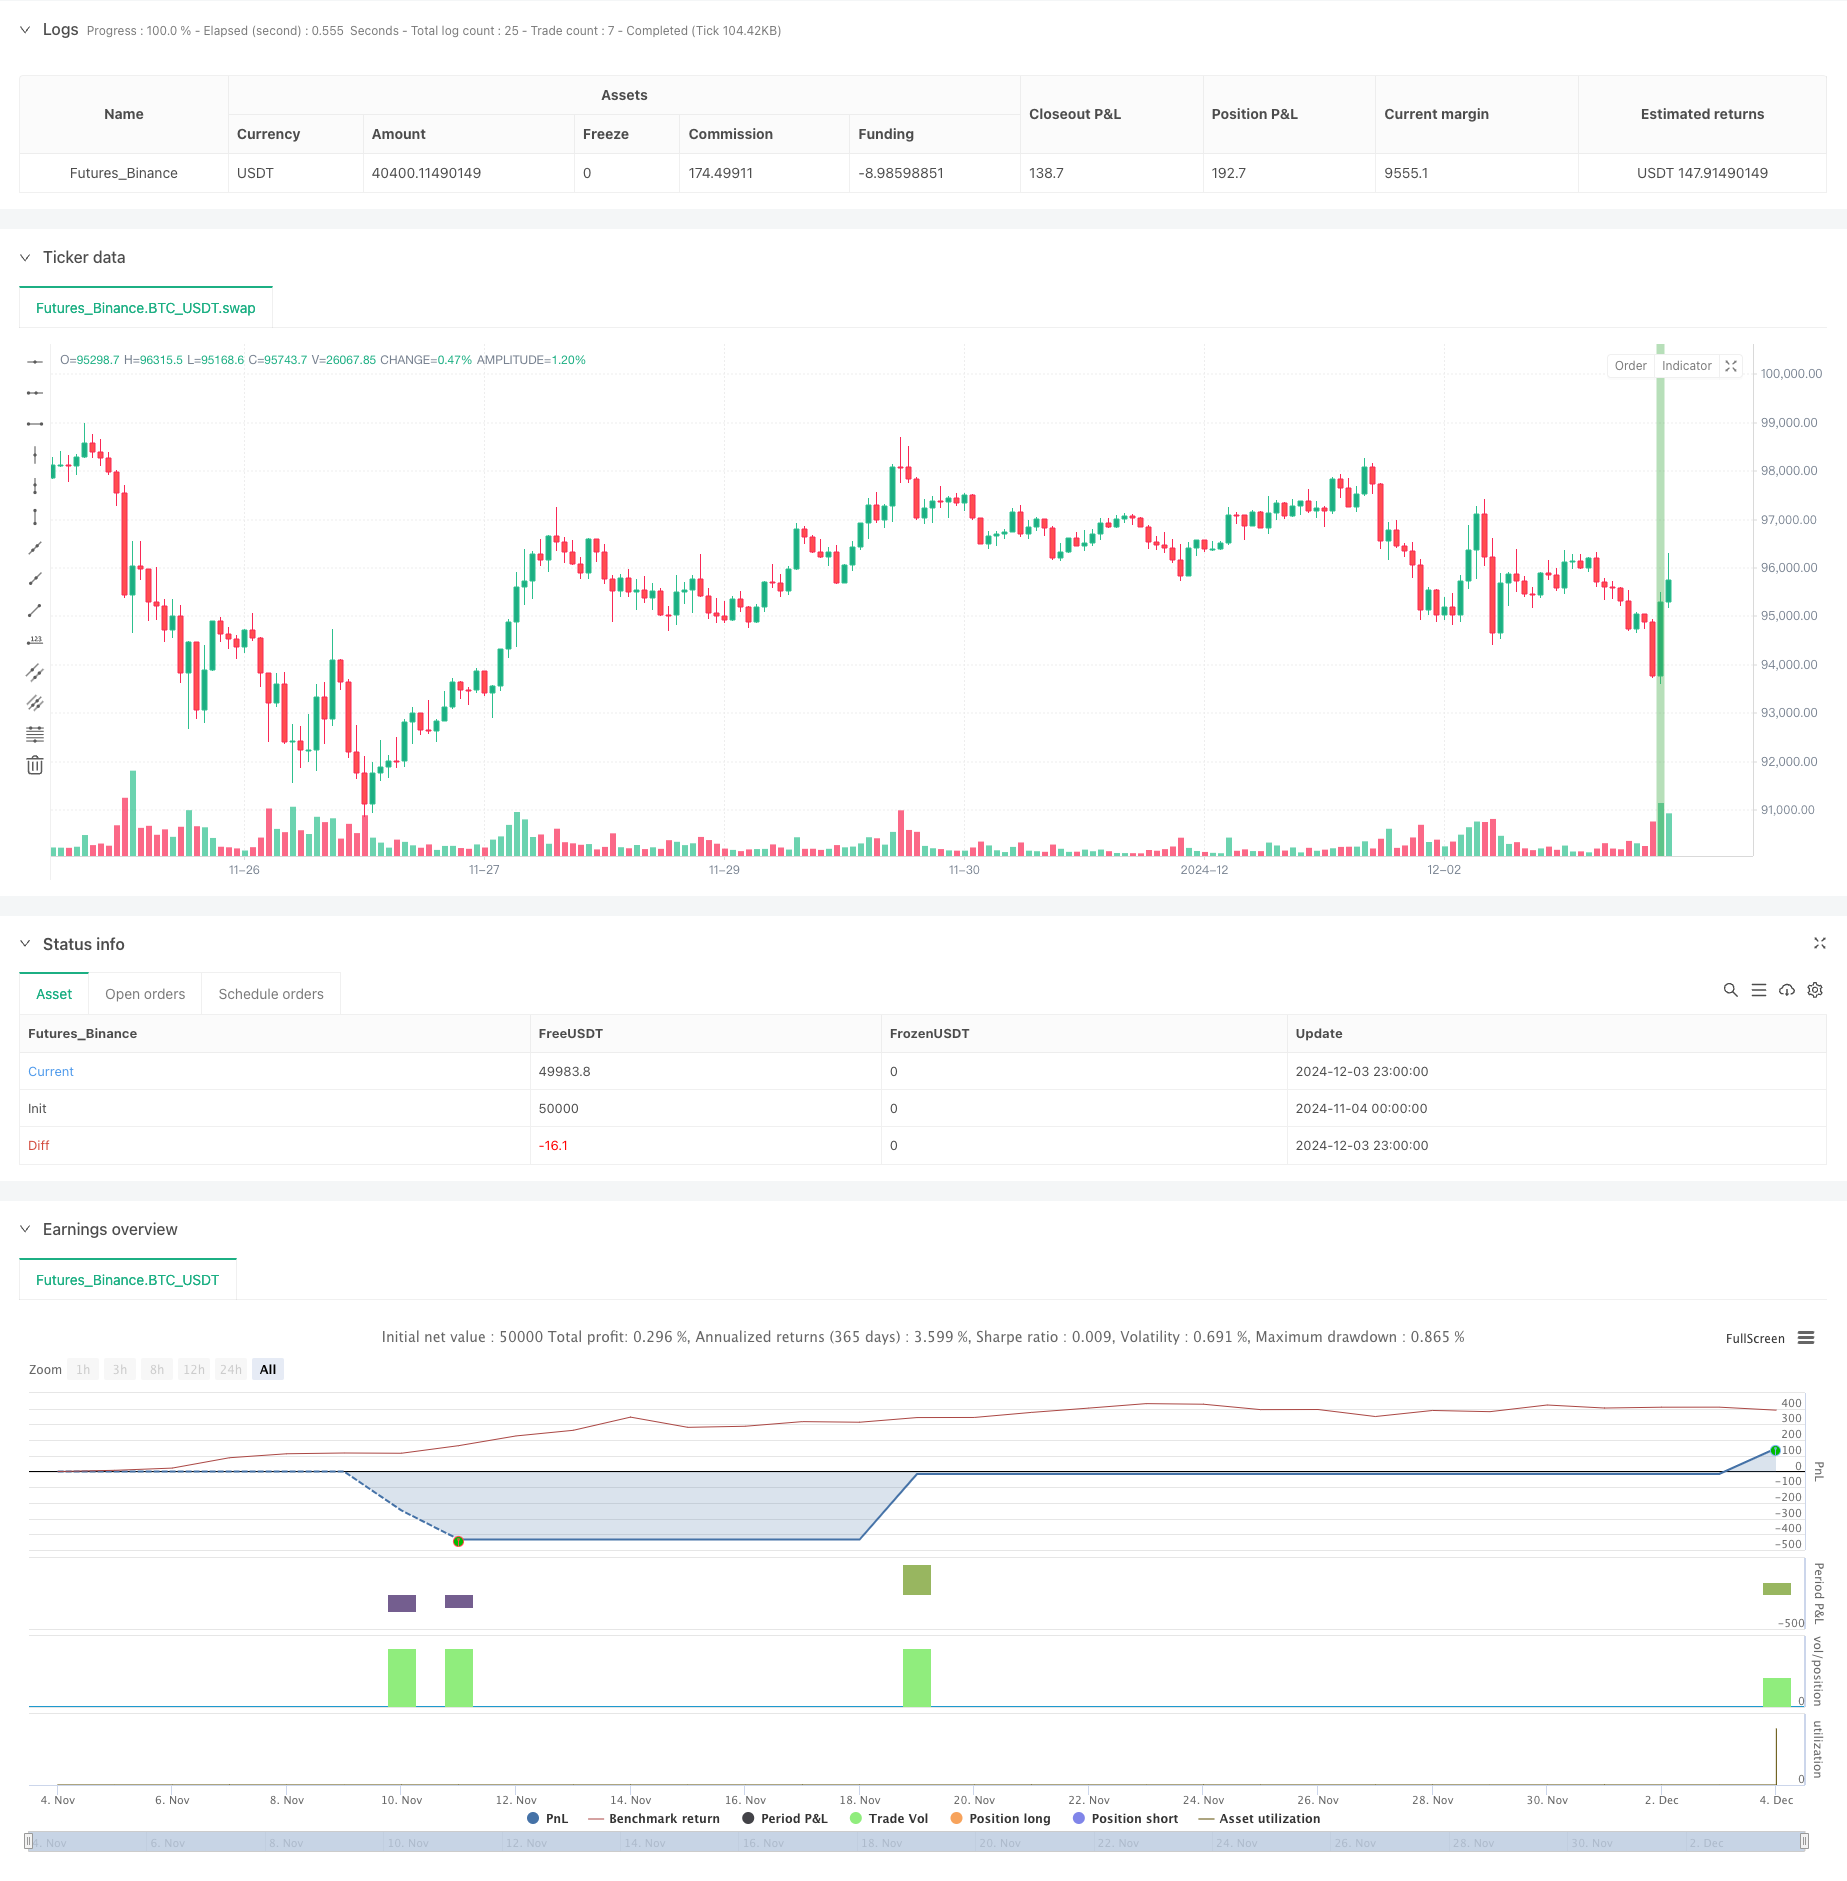
策略概述
本策略是一个基于RSI指标和均值回归原理的量化交易系统。它通过识别市场的超买超卖状态,结合价格波动范围和收盘价位置来捕捉市场反转机会。策略的核心思想是在市场出现极端状态后寻找回归机会,通过设置严格的入场条件和动态止损来管理风险。
策略原理
策略采用多重过滤机制来确定交易信号:首先需要价格创出10个周期新低,表明市场处于超卖状态;其次要求当日价格波动范围为近10个交易日最大,说明市场波动加剧;最后通过判断收盘价是否位于当日价格区间的上四分位来确认潜在的反转信号。入场采用突破方式,在符合条件后的2个交易日内,如果价格突破前期高点则开仓做多。止损采用追踪止损方式,以保护既有利润。
策略优势
- 多重过滤条件提高了信号质量,减少了虚假信号
- 结合了技术分析中的价格形态、波动率和动量等多个维度
- 使用追踪止损机制,可以有效地保护盈利
- 入场机制采用突破确认,避免过早介入
- 交易逻辑清晰,易于理解和实现
策略风险
- 在强趋势市场中可能会频繁触发止损
- 入场条件较为严格,可能会错过一些交易机会
- 需要较高的交易频率,可能产生较高的交易成本
- 在低波动率环境下可能难以找到有效的交易信号
- 止损设置可能过于保守,影响整体收益率
策略优化方向
- 可以引入趋势过滤器,在强趋势环境下暂停交易
- 考虑加入成交量指标作为辅助确认
- 优化止损设置,可以根据市场波动率动态调整
- 增加持仓时间的限制,避免过长时间的震荡
- 考虑加入多周期分析,提高信号可靠性
总结
这是一个结构完整、逻辑清晰的均值回归策略。通过多重条件过滤和动态止损管理,策略在控制风险的同时,能够有效捕捉市场超跌反弹机会。虽然存在一些局限性,但通过合理的优化和完善,策略的整体表现仍有提升空间。建议投资者在实盘应用时,需要根据具体市场特点和自身风险承受能力进行参数调整。
策略源码
/*backtest
start: 2024-11-04 00:00:00
end: 2024-12-04 00:00:00
period: 1h
basePeriod: 1h
exchanges: [{"eid":"Futures_Binance","currency":"BTC_USDT"}]
*/

//@version=5
strategy("Larry Conners SMTP Strategy", overlay=true, margin_long=100, margin_short=100)

// --- Inputs ---
// Corrected the input type declaration by removing 'type='
tickSize = input.float(0.01, title="Tick Size (e.g., 1/8 for stocks)")

// --- Calculate conditions ---
// 1. Today the market must make a 10-period low
low10 = ta.lowest(low, 10)
is10PeriodLow = low == low10

// 2. Today's range must be the largest of the past 10 bars
rangeToday = high - low
maxRange10 = ta.highest(high - low, 10)
isLargestRange = rangeToday == maxRange10

// 3. Today's close must be in the top 25 percent of today's range
rangePercent = (close - low) / rangeToday
isCloseInTop25 = rangePercent >= 0.75

// Combine all buy conditions
buyCondition = is10PeriodLow and isLargestRange and isCloseInTop25

// --- Buy Entry (on the next day) ---
var float buyPrice = na
var bool orderPending = false
var float stopLoss = na  // Initialize stopLoss at the top level to avoid 'Undeclared identifier' errors

if (buyCondition and strategy.position_size == 0)
    buyPrice := high + tickSize
    stopLoss := low
    orderPending := true

// Condition to place buy order the next day or the day after
if orderPending and ta.barssince(buyCondition) <= 2
    strategy.entry("Buy", strategy.long, stop=buyPrice)
    orderPending := false

// --- Stop-Loss and Trailing Stop ---
if (strategy.position_size > 0)
    stopLoss := math.max(stopLoss, low) // Move stop to higher lows (manual trailing)
    strategy.exit("Exit", from_entry="Buy", stop=stopLoss)

// --- Plotting ---
// Highlight buy conditions
bgcolor(buyCondition ? color.new(color.green, 50) : na)
//plotshape(series=buyCondition, location=location.belowbar, color=color.green, style=shape.labelup, text="Buy Setup")

// Plot Stop-Loss level for visualization
//plot(strategy.position_size > 0 ? stopLoss : na, color=color.red, linewidth=2, title="Stop-Loss Level")
相关推荐