Multi-Indicator Trend Momentum Crossover Quantitative Strategy

Overview
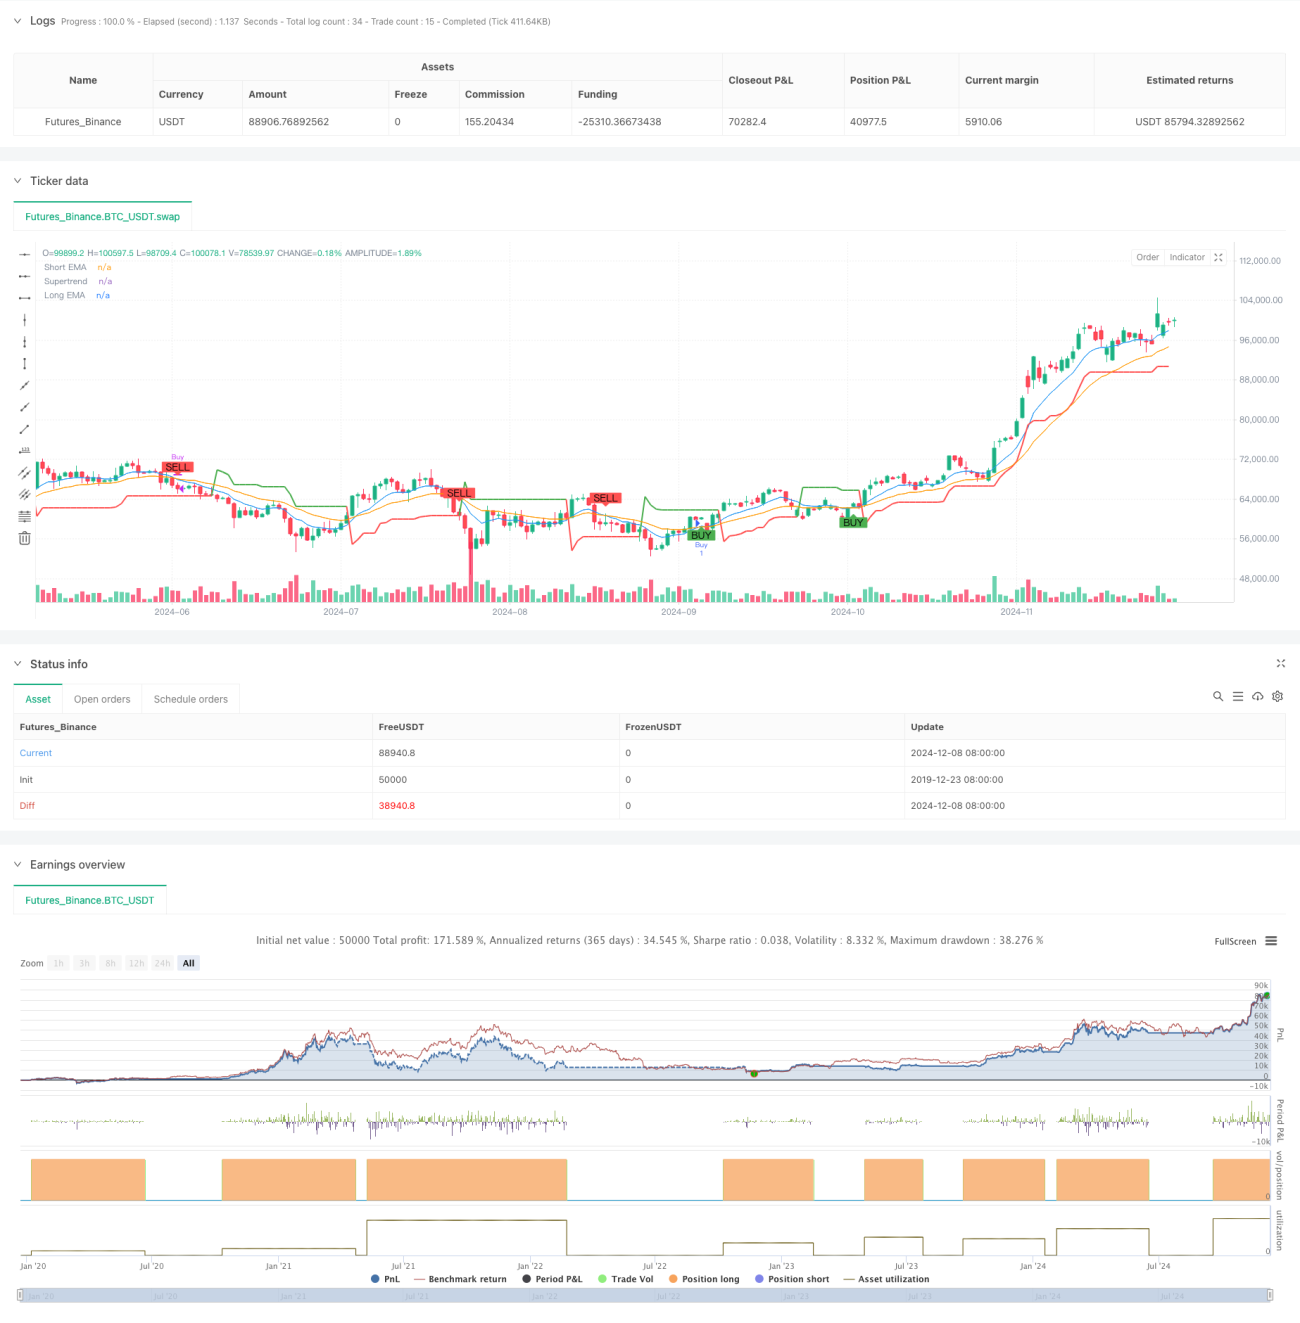
This is a multi-indicator trading strategy that combines Supertrend, Exponential Moving Average (EMA), and Relative Strength Index (RSI). The strategy identifies market trends, momentum, and potential reversal points through the crossover signals and overbought/oversold levels of these three technical indicators, seeking optimal trading opportunities in the market. The strategy leverages the advantages of multiple indicators to enhance trading accuracy and reliability through market analysis from different dimensions.
Strategy Principles
The core logic is based on the combined analysis of three main technical indicators:
- Supertrend indicator determines overall trend direction using ATR volatility for dynamic trend line adjustment.
- Crossovers of short-term (9-period) and long-term (21-period) EMAs capture price momentum changes.
- RSI indicator identifies overbought or oversold market conditions.
Buy signals require all of the following conditions:
- Supertrend shows bullish trend (price above Supertrend line)
- Short-term EMA crosses above long-term EMA
- RSI is not overbought (below 70)
Sell signals require all of the following conditions:
- Supertrend shows bearish trend (price below Supertrend line)
- Short-term EMA crosses below long-term EMA
- RSI is not oversold (above 30)
Strategy Advantages
- Multi-indicator cross-validation improves signal reliability
- Combines benefits of trend following and momentum analysis
- RSI filters out potential false signals
- Strategy parameters can be flexibly adjusted for different market conditions
- Clear entry and exit rules reduce subjective judgment influence
- Incorporates solid risk control mechanisms
Strategy Risks
- May generate frequent false signals in ranging markets
- Multiple indicators' lag may delay entry and exit timing
- Improper parameter selection can affect strategy performance
- Sudden market changes may lead to significant drawdowns
- Trading costs need to be considered for strategy profitability
Strategy Optimization Directions
- Introduce adaptive parameter mechanisms to dynamically adjust indicator parameters based on market volatility
- Add volume-price analysis indicators to enhance signal reliability
- Develop market environment recognition module to use different parameter combinations in different market conditions
- Implement stop-loss and take-profit mechanisms to optimize money management
- Consider adding volatility filters to avoid overtrading in low volatility environments
Summary
This is a well-structured, logically sound multi-indicator quantitative trading strategy that builds a comprehensive trading system by combining trend following, momentum analysis, and overbought/oversold indicators. The strategy's strength lies in its multi-indicator cross-validation for improved signal reliability and clear risk control mechanisms. While inherent risks exist, continuous optimization and refinement could help maintain stable performance across different market environments.
/*backtest
start: 2019-12-23 08:00:00
end: 2024-12-09 08:00:00
period: 1d
basePeriod: 1d
exchanges: [{"eid":"Futures_Binance","currency":"BTC_USDT"}]
*/

// This Pine Script™ code is subject to the terms of the Mozilla Public License 2.0 at https://mozilla.org/MPL/2.0/
// © satyakipaul3744

//@version=6- 1