SMA-RSI-MACD Multi-Indicator Dynamic Limit Order Trading Strategy

Overview
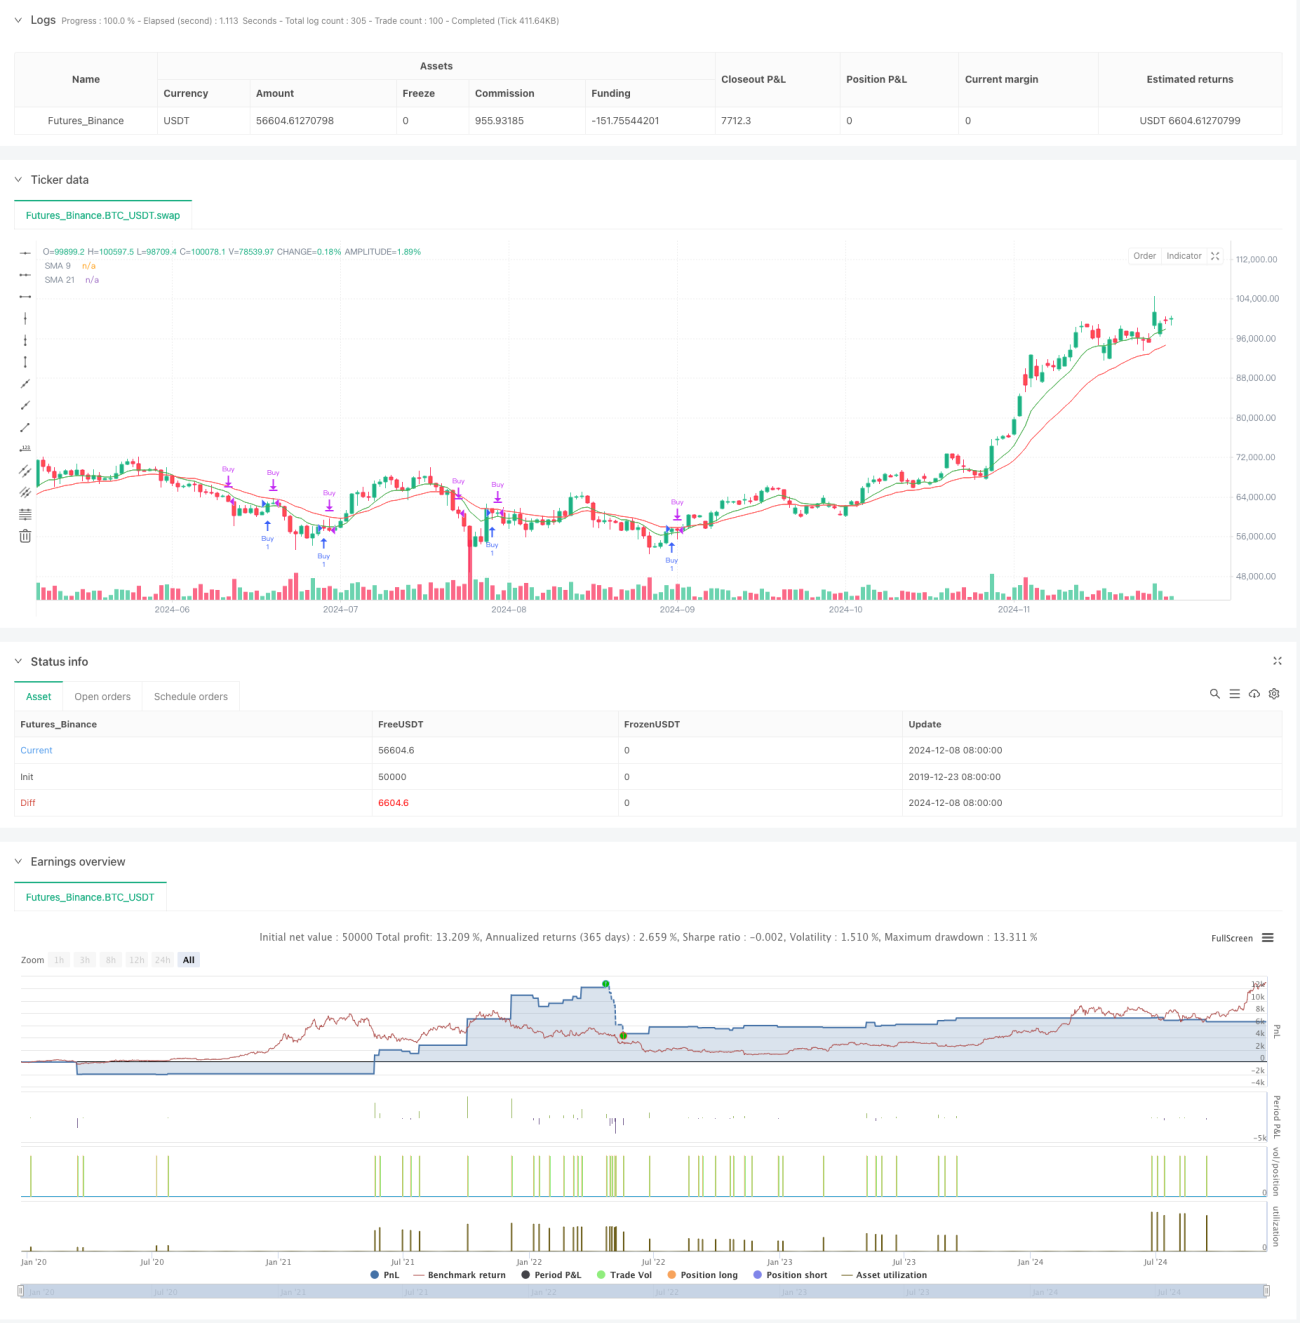
This strategy is a multi-technical indicator trading system that primarily uses EMA crossover, RSI oversold conditions, and MACD golden cross for trade confirmation. It employs dynamic limit orders for entry and multiple exit mechanisms for risk management. The strategy uses 9-period and 21-period Exponential Moving Averages (EMA) as primary trend indicators, combined with Relative Strength Index (RSI) and Moving Average Convergence Divergence (MACD) to filter trading signals.
Strategy Principles
The core trading logic includes the following key components:
- Entry signals are triggered when 9-period EMA crosses above 21-period EMA
- Entry price is set as a limit order below the 9-period EMA at a specified offset
- Trade confirmation requires RSI below threshold and MACD golden cross
- Exit signals include MACD death cross, fixed profit/loss points, and forced closing at market end
- Trading time is restricted between 9:30 AM and 3:10 PM
The strategy uses limit orders for entry to achieve better entry prices and combines multiple technical indicators to improve trading accuracy.
Strategy Advantages
- Multiple signal confirmation mechanism improves trade reliability
- Limit order entries provide better execution prices
- Fixed profit/loss points facilitate risk control
- Forced closing at market end eliminates overnight risk
- Trading time restrictions avoid opening volatility
- EMA indicators provide faster trend response
- RSI and MACD combination helps filter false signals
Strategy Risks
- Multiple signal confirmation may cause missed opportunities
- Limit orders might not execute in rapid price movements
- Fixed point stops may result in larger losses during high volatility
- MACD signals may lag behind price action
- Strategy doesn't account for changes in market volatility
- Parameter optimization may lead to overfitting
Strategy Optimization Directions
- Introduce adaptive stop-loss and take-profit points based on market volatility
- Add volume indicators as additional confirmation signals
- Consider adding trend strength filters
- Optimize limit order offset calculation using ATR
- Include market sentiment indicators to filter unfavorable conditions
- Add position sizing mechanism based on signal strength
Summary
This is a well-structured multi-indicator trading strategy that identifies trends using moving averages, filters signals with RSI and MACD, and controls risk through limit orders and multiple stop mechanisms. The strategy's strengths lie in its signal reliability and comprehensive risk control, though it faces challenges with signal lag and parameter optimization. There is significant room for improvement through dynamic parameter adjustment and additional auxiliary indicators. It is suitable for conservative investors in trending market conditions.
- 1