Multi-EMA Trend Following Trading Strategy

Overview
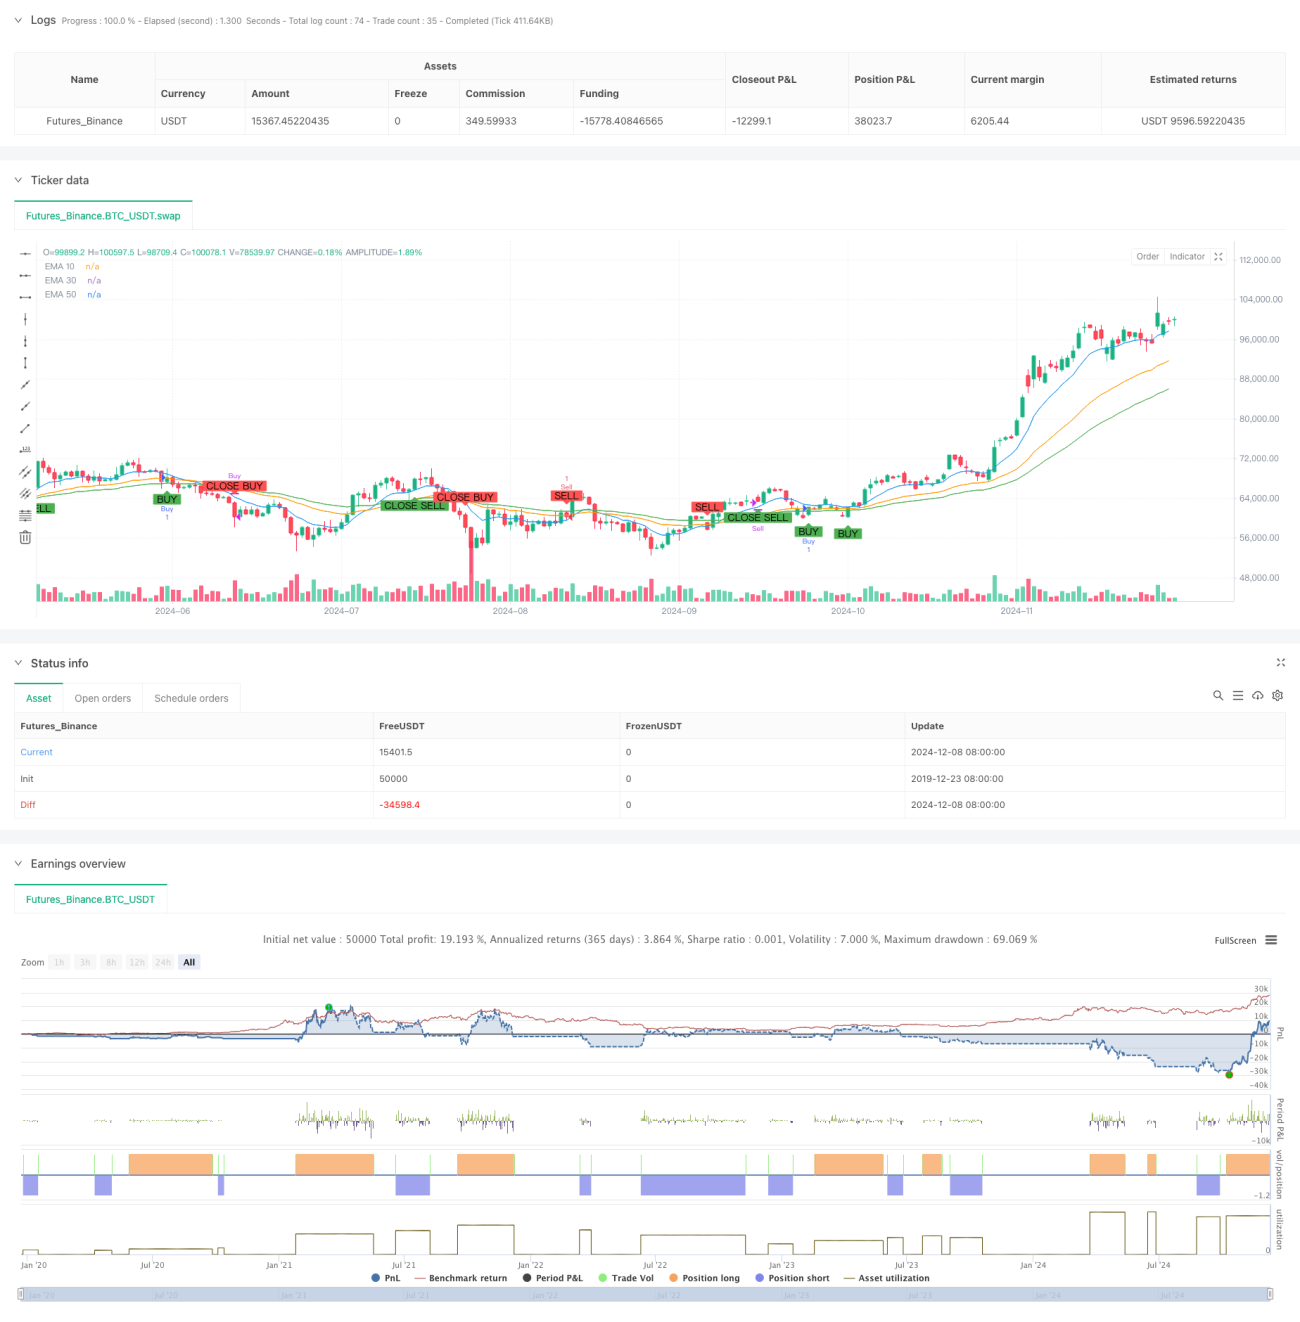
This strategy is a trend following trading system based on multiple Exponential Moving Averages (EMAs). By utilizing three EMAs with different periods (10, 30, 50), combined with price crossovers and trend direction analysis, it constructs a complete buy and sell signal system. The strategy thoroughly considers trend formation, confirmation, and reversal, effectively capturing major trending opportunities in the market.
Strategy Principle
The strategy employs a hierarchical judgment mechanism to determine trading signals:
- Trend Determination Layer: Uses the relative positions of three EMAs (10/30/50) to judge trend direction. An uptrend is identified when EMA10 > EMA30 > EMA50; a downtrend when EMA50 > EMA30 > EMA10.
- Signal Trigger Layer: Once a trend is established, trading signals are triggered by price crossovers with EMA30. Upward crosses trigger buy signals, downward crosses trigger sell signals.
- Position Management Layer: When EMA30 crosses EMA50 in the opposite direction, it triggers corresponding position closing signals, providing a systematic exit mechanism.
Strategy Advantages
- Multiple Confirmation Mechanism: Multiple line arrangements and crossovers provide multiple confirmations, reducing false signal interference.
- Strong Trend Following: Effectively captures major trends while filtering short-term fluctuations.
- Systematic Approach: Clear entry and exit conditions, minimizing subjective judgment.
- Good Adaptability: Can adapt to different market environments through EMA parameter adjustments.
- Reasonable Risk Control: Timely stop-loss through trend reversal signals.
Strategy Risks
- Sideways Market Risk: May generate frequent false signals during market consolidation, leading to consecutive losses.
- Lag Risk: EMA systems have inherent lag, potentially missing important price opportunities at trend beginnings.
- Gap Risk: May encounter significant price gaps during volatile periods, affecting strategy performance.
- Parameter Sensitivity: Different parameter combinations may lead to significant performance variations.
Strategy Optimization Directions
- Incorporate Volatility Indicators: Suggest adding ATR or similar indicators for dynamic position sizing and improved capital efficiency.
- Optimize Signal Filtering: Can add volume, momentum, or other auxiliary indicators to filter false signals.
- Improve Stop-Loss Mechanism: Recommend adding trailing stop-loss functionality for better profit protection.
- Add Time Filters: Consider adding trading time restrictions to avoid highly volatile periods.
- Parameter Adaptation: Consider introducing adaptive mechanisms for dynamic EMA parameter adjustment based on market conditions.
Summary
This is a well-designed trend following strategy with clear logic. The combination of multiple EMAs ensures both strategy stability and clear trading signals. While there are some inherent lag risks, the strategy demonstrates good practical value through reasonable optimization and risk control measures. It is particularly suitable for traders seeking stable returns with controlled risk.
- 1