
Overview
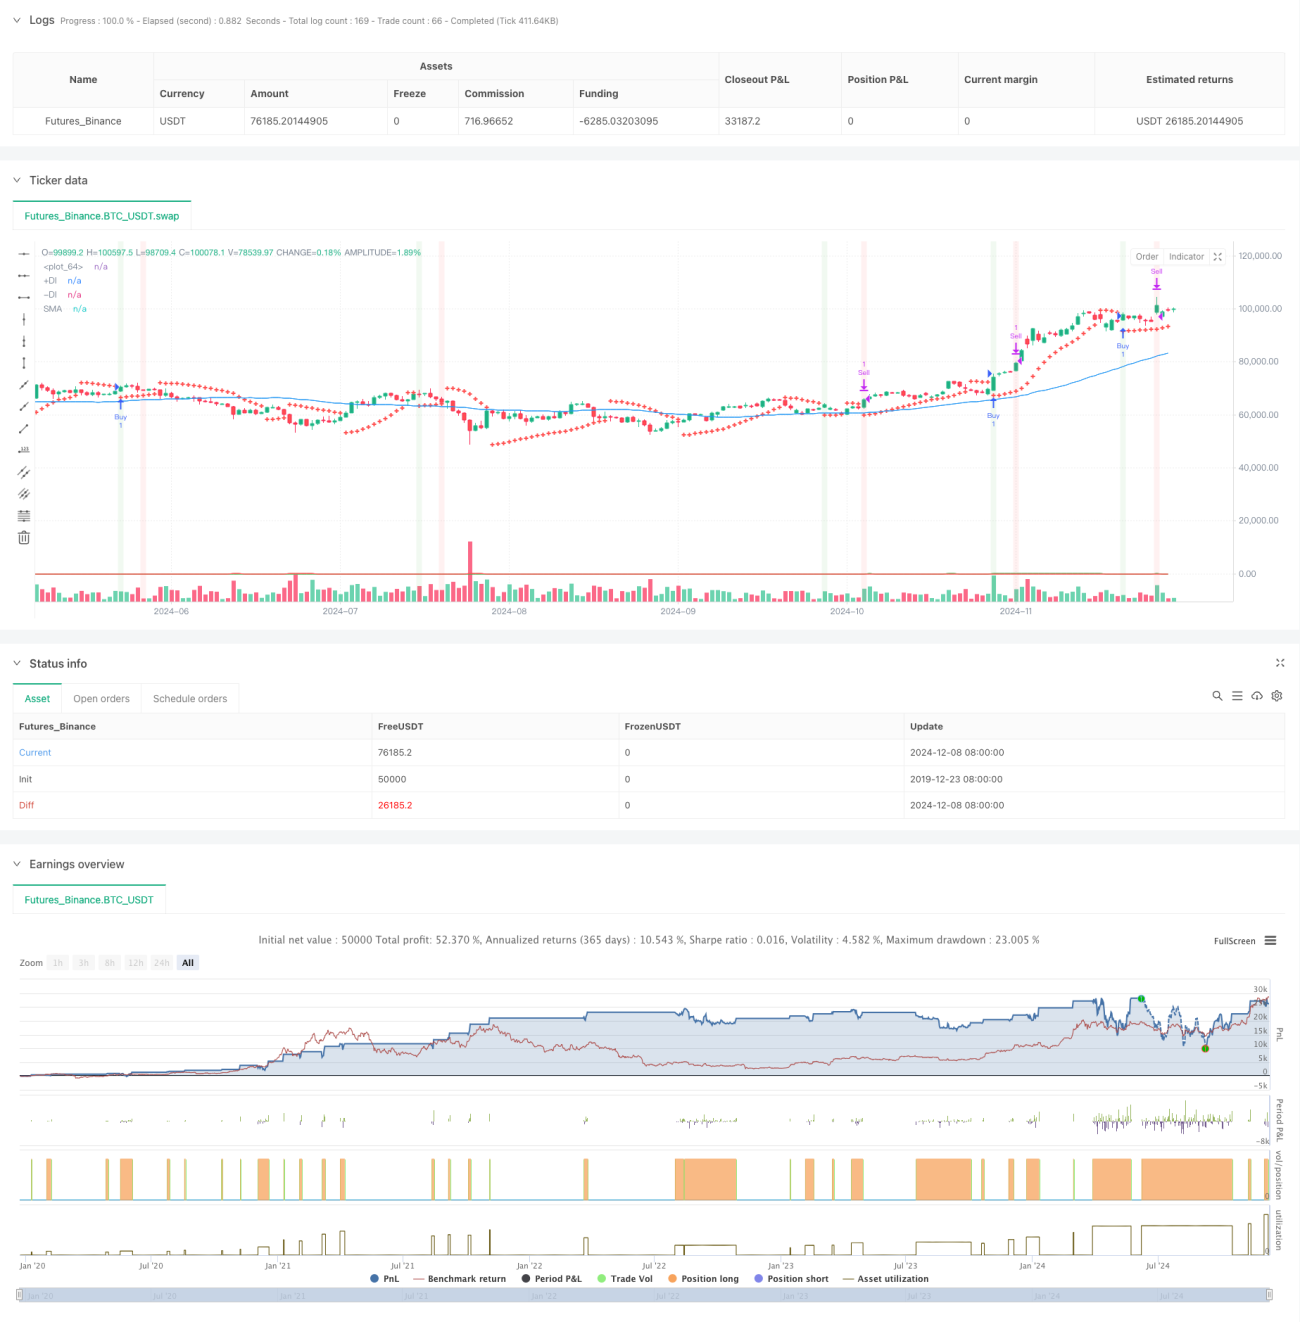
This strategy is a trend-following trading system that combines multiple technical indicators. It primarily uses the Parabolic SAR, Simple Moving Average (SMA), and Directional Movement Index (DMI) to determine market trends and entry points, while optimizing exits through percentage-based profit targets and MACD divergence. The core concept is to enter positions after confirming strong trends and exit when reaching preset profit targets or when trend reversal signals appear.
Strategy Principles
The strategy employs a multi-layered filtering mechanism:
- Initial trading signals are captured through SAR crossovers
- Overall trend direction is determined using a 50-period SMA
- DMI indicator confirms trend strength and direction
- Entry conditions require: price crossing above SAR, price above SMA, and bullish DMI
- Dual exit mechanism: 3% target profit or MACD bearish crossover
- ATR indicator for market volatility reference
Strategy Advantages
- Multiple technical indicator cross-validation reduces false signals
- Combination of trend following and momentum indicators improves success rate
- Fixed percentage profit targets ensure consistent gains
- MACD divergence exit mechanism prevents trend reversal drawdowns
- Strategy parameters can be flexibly adjusted for different market characteristics
- ATR monitoring provides market state reference
Strategy Risks
- Multiple indicators may lead to signal lag
- Fixed percentage profit targets might result in early exits during strong trends
- Lack of stop-loss mechanism increases risk exposure
- Excessive false signals may occur in ranging markets
- DMI indicators may generate misleading signals in choppy markets
Optimization Directions
- Implement adaptive stop-loss mechanism using ATR-based dynamic stops
- Develop volatility filters to adjust position sizing during high volatility periods
- Optimize MACD parameters for improved trend reversal detection
- Add volume confirmation mechanism for enhanced signal reliability
- Develop dynamic profit targets based on market volatility
Summary
This strategy builds a relatively complete trend-following trading system through the coordination of multiple technical indicators. Its strength lies in signal confirmation reliability and risk control flexibility. While there are inherent lag risks, the strategy maintains good practical value through parameter optimization and dynamic management mechanisms. Through continuous optimization and improvement, this strategy can serve as a robust trading tool.
- 1