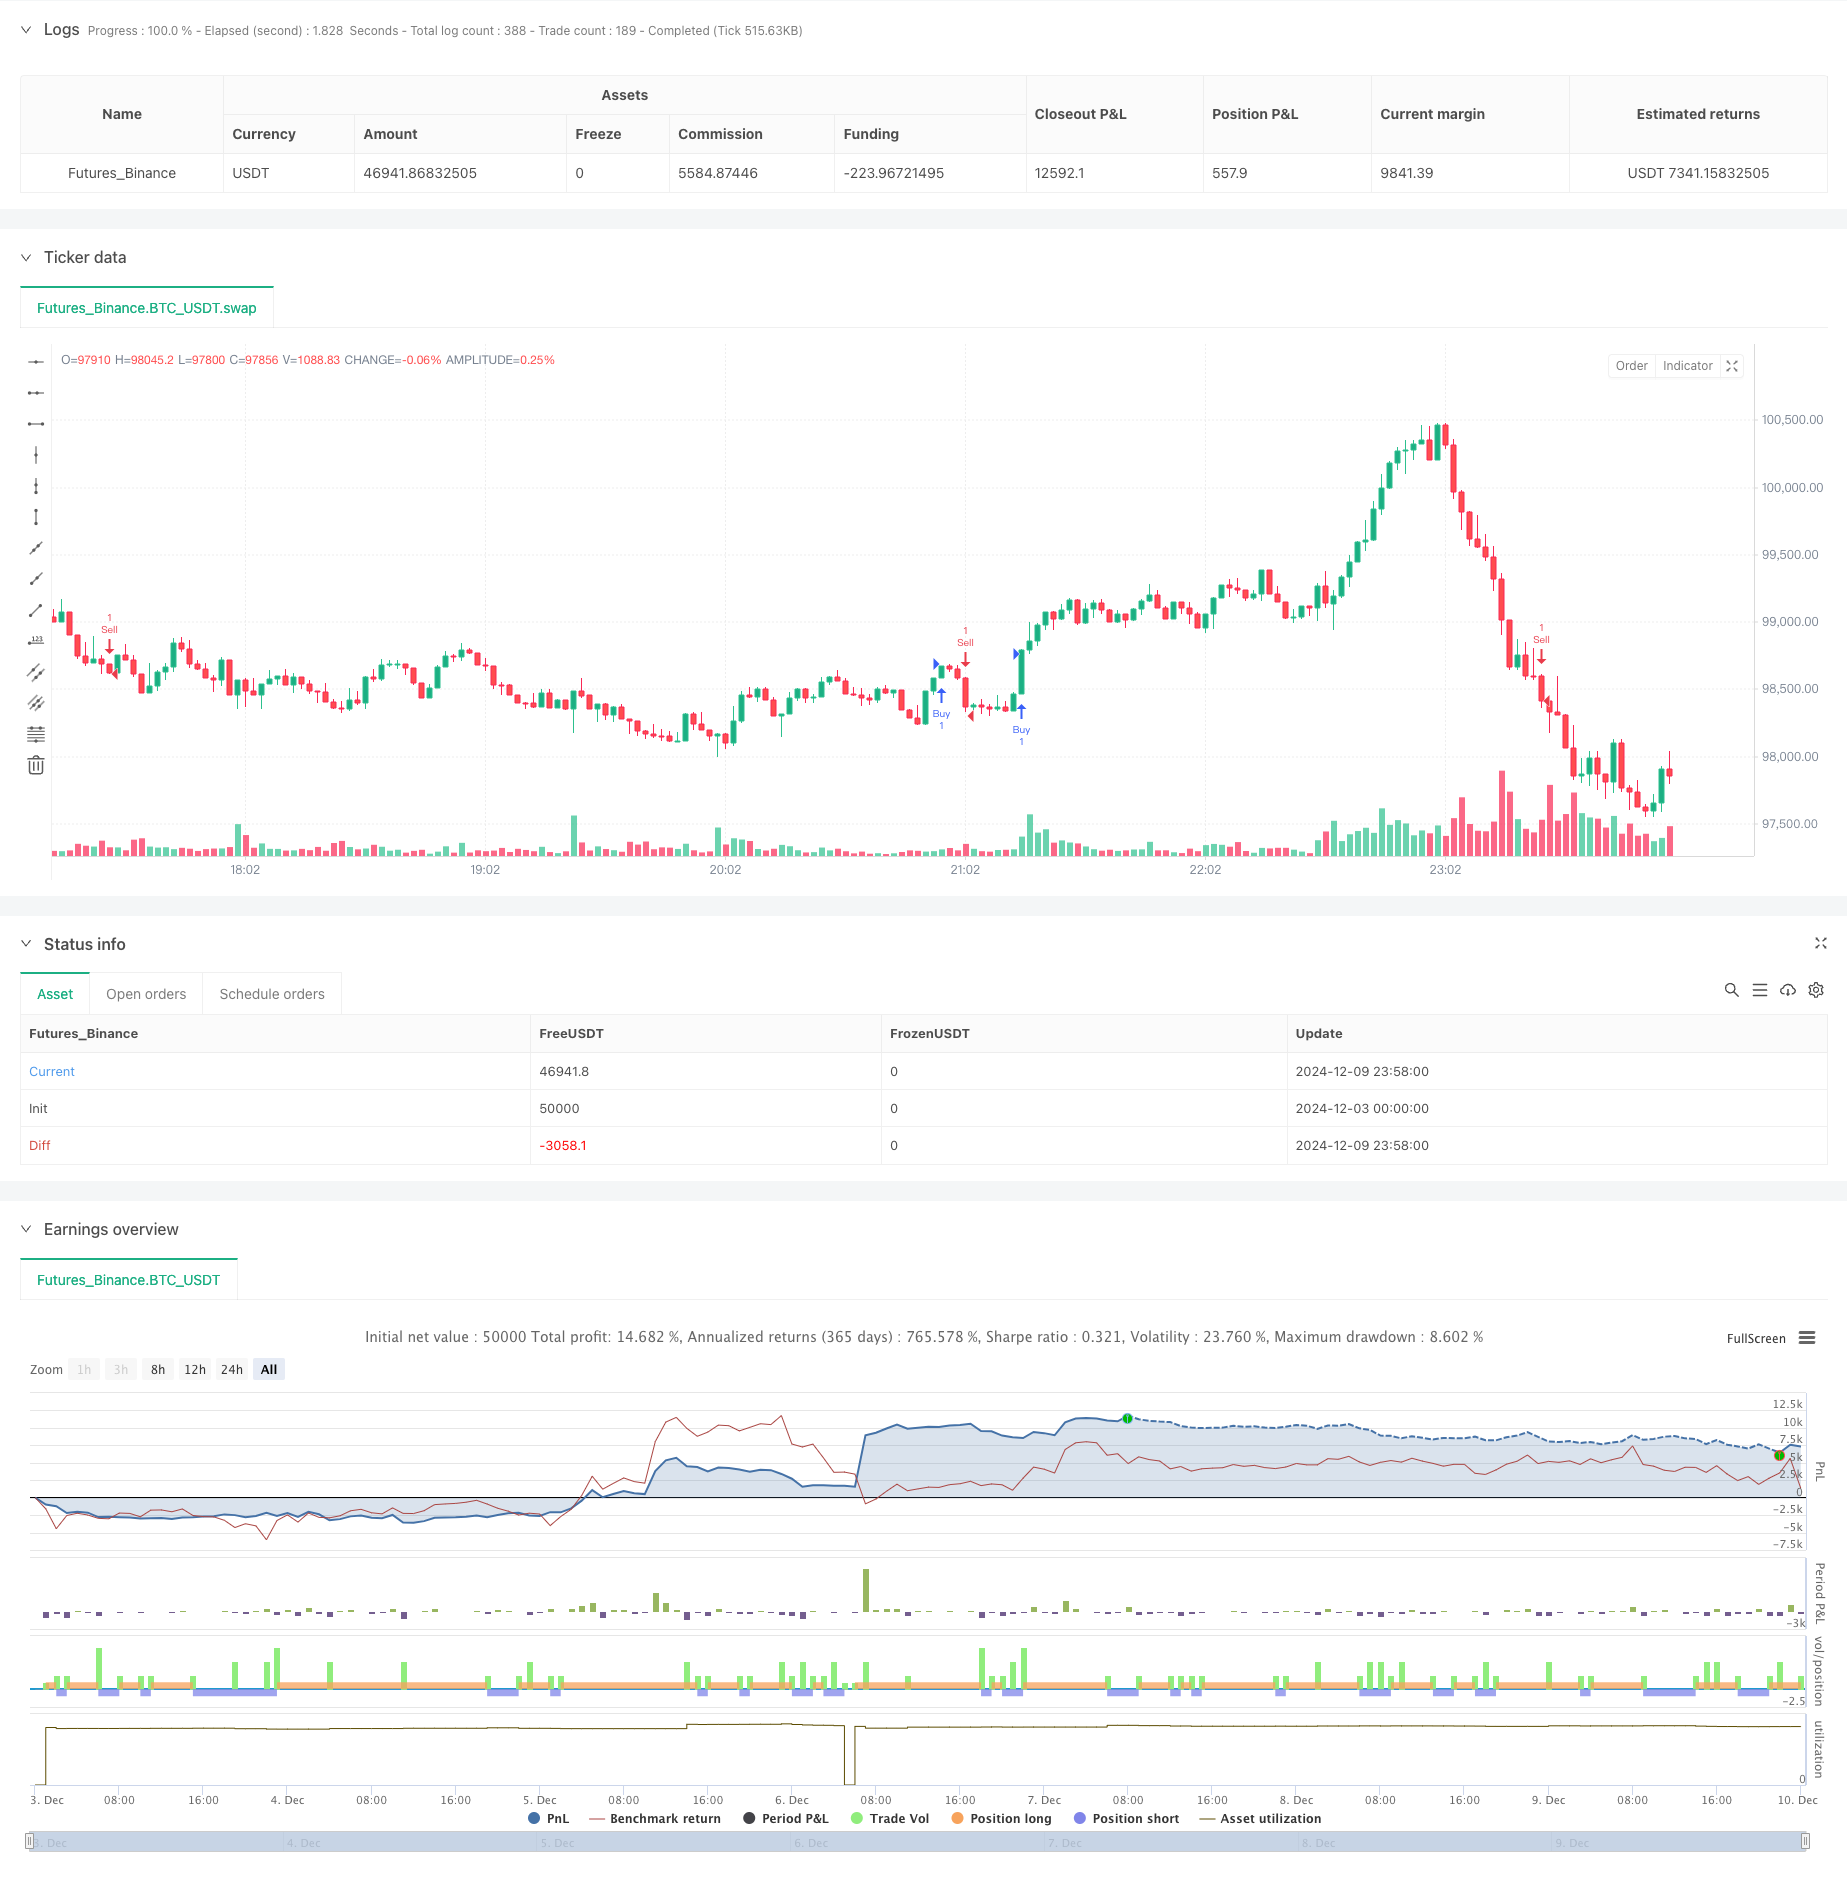
概述
该策略是一个基于斐波那契回撤水平和K线形态的趋势交易系统。它在多个时间周期上运行,结合了技术分析和风险管理原则。策略主要通过识别关键的斐波那契回撤水平(0.618和0.786)来寻找潜在的交易机会,同时利用止损和获利目标来管理风险。
策略原理
策略的核心逻辑基于以下几个关键要素: 1. 时间周期选择:策略允许在4小时、日线、周线和月线等多个时间周期上运行,以适应不同的交易风格。 2. 斐波那契水平计算:使用50个周期的最高价和最低价计算0.618和0.786两个关键的回撤水平。 3. 入场信号生成:当收盘价在特定条件下突破斐波那契水平时,系统会生成做多或做空信号。做多信号要求收盘价高于开盘价且位于0.618水平之上;做空信号则需要收盘价低于开盘价且位于0.786水平之下。 4. 风险管理:策略采用固定百分比止损,并通过预设的风险收益比来确定获利目标。
策略优势
- 多周期适应性:通过在不同时间周期上运行,策略可以适应不同的市场环境和交易风格。
- 系统化风险管理:通过预设的止损和获利目标,确保每笔交易都有明确的风险控制。
- 技术指标整合:结合了斐波那契回撤和K线形态分析,提供更可靠的交易信号。
- 可定制性强:关键参数如斐波那契水平、风险收益比和止损百分比都可以根据个人偏好调整。
策略风险
- 市场波动风险:在高波动期间,价格可能快速突破止损位导致损失。
- 假突破风险:市场可能出现虚假的斐波那契水平突破信号。
- 参数优化风险:过度优化参数可能导致策略在实盘中表现不佳。
- 流动性风险:在某些时间周期或市场条件下,可能面临流动性不足的问题。
策略优化方向
- 增加市场趋势过滤器:可以添加移动平均线或其他趋势指标来过滤逆势信号。
- 优化入场时机:考虑增加成交量确认或动量指标来提高入场的准确性。
- 动态止损管理:实现基于波动率的动态止损,以适应不同市场条件。
- 增加时间过滤:添加交易时间窗口限制,避免在不利的市场时段交易。
- 多维度信号确认:整合其他技术指标来提供额外的信号确认。
总结
这是一个结构完善的趋势跟踪策略,通过结合斐波那契回撤、K线形态和风险管理原则,为交易者提供了一个系统化的交易方法。虽然存在一定的风险,但通过建议的优化方向可以进一步提升策略的稳定性和可靠性。策略的多周期特性和可定制参数使其适合不同类型的交易者使用。
策略源码
/*backtest
start: 2024-12-03 00:00:00
end: 2024-12-10 00:00:00
period: 2m
basePeriod: 2m
exchanges: [{"eid":"Futures_Binance","currency":"BTC_USDT"}]
*/

// This Pine Script™ code is subject to the terms of the Mozilla Public License 2.0 at https://mozilla.org/MPL/2.0/
// © jontucklogic7467

//@version=5
strategy("Fibonacci Swing Trading Bot", overlay=true)

// Input parameters
fiboLevel1 = input.float(0.618, title="Fibonacci Retracement Level 1")
fiboLevel2 = input.float(0.786, title="Fibonacci Retracement Level 2")
riskRewardRatio = input.float(2.0, title="Risk/Reward Ratio")
stopLossPerc = input.float(1.0, title="Stop Loss Percentage") / 100

// Timeframe selection
useTimeframe = input.timeframe("240", title="Timeframe for Analysis", options=["240", "D", "W", "M"])

// Request data from selected timeframe
highTF = request.security(syminfo.tickerid, useTimeframe, high)
lowTF = request.security(syminfo.tickerid, useTimeframe, low)

// Swing high and low calculation over the last 50 bars in the selected timeframe
highestHigh = ta.highest(highTF, 50)
lowestLow = ta.lowest(lowTF, 50)

// Fibonacci retracement levels
fib618 = highestHigh - (highestHigh - lowestLow) * fiboLevel1
fib786 = highestHigh - (highestHigh - lowestLow) * fiboLevel2

// Plot Fibonacci levels
// line.new(bar_index[1], fib618, bar_index, fib618, color=color.red, width=2, style=line.style_dashed)
// line.new(bar_index[1], fib786, bar_index, fib786, color=color.orange, width=2, style=line.style_dashed)

// Entry signals based on candlestick patterns and Fibonacci levels
bullishCandle = close > open and close > fib618 and close < highestHigh
bearishCandle = close < open and close < fib786 and close > lowestLow

// Stop loss and take profit calculation
stopLoss = bullishCandle ? close * (1 - stopLossPerc) : close * (1 + stopLossPerc)
takeProfit = bullishCandle ? close + (close - stopLoss) * riskRewardRatio : close - (stopLoss - close) * riskRewardRatio

// Plot buy and sell signals
if bullishCandle
    strategy.entry("Buy", strategy.long)
    strategy.exit("Take Profit", "Buy", limit=takeProfit, stop=stopLoss)

if bearishCandle
    strategy.entry("Sell", strategy.short)
    strategy.exit("Take Profit", "Sell", limit=takeProfit, stop=stopLoss)
相关推荐