
Overview
This strategy is a quantitative trading system that combines the Accelerator Oscillator (AC) and Stochastic indicators. It captures market momentum shifts by identifying divergences between price and technical indicators to predict potential trend reversals. The strategy also incorporates Simple Moving Averages (SMA) and Relative Strength Index (RSI) to enhance signal reliability, with fixed take-profit and stop-loss levels for risk control.
Strategy Principle
The core logic is based on the synergy of multiple technical indicators. The AC is calculated using the difference between 5-period and 34-period SMAs of price midpoints, minus its N-period moving average. Stochastic K and D values are calculated to confirm divergence signals. Bullish divergence forms when price makes new lows while AC rises; bearish divergence forms when price makes new highs while AC falls. RSI is incorporated as an additional confirmation indicator, using cross-validation of multiple indicators to improve signal accuracy.
Strategy Advantages
- Multiple indicator synergy: Effectively filters false signals through the combination of AC, Stochastic, and RSI
- Automated risk control: Built-in fixed take-profit and stop-loss settings effectively control risk per trade
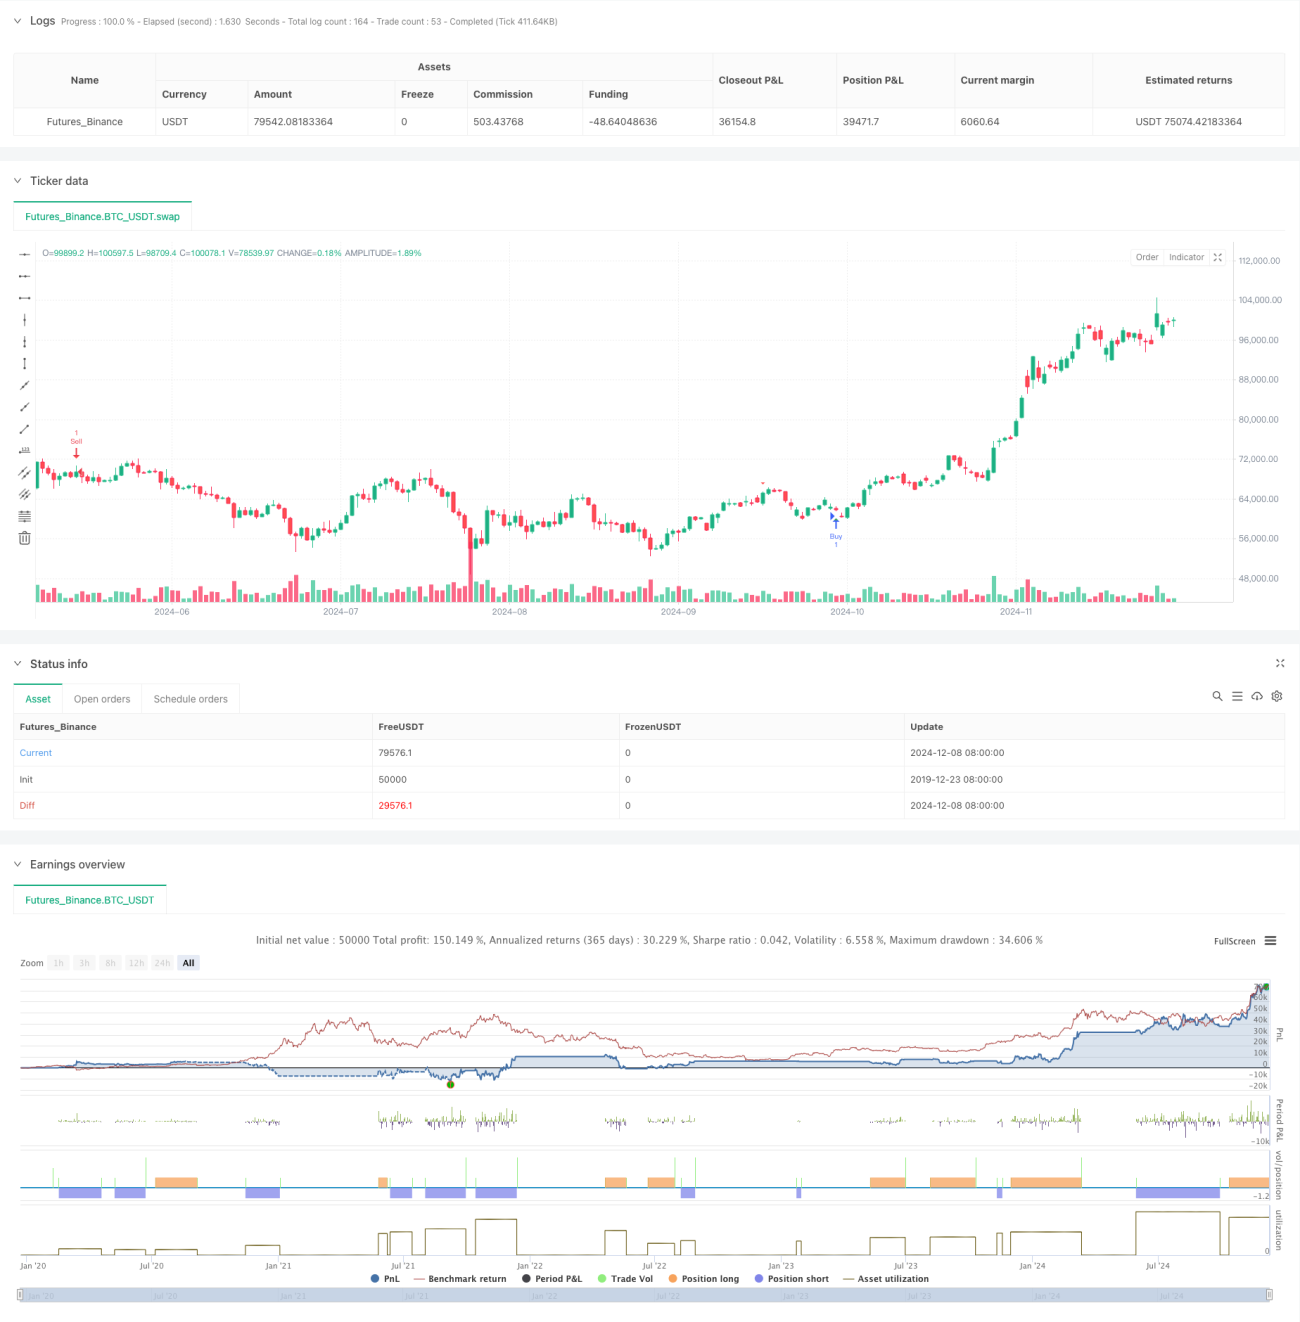
- Visual cues: Clear buy and sell signals marked on charts for quick opportunity identification
- High flexibility: Strong parameter customization suitable for different market conditions and timeframes
- Real-time alerts: Integrated alert system ensures no trading opportunities are missed
Strategy Risks
- False breakout risk: May generate false divergence signals in ranging markets
- Slippage risk: Fixed pip take-profit and stop-loss may face significant slippage in volatile markets
- Parameter sensitivity: Different parameter combinations may lead to varying strategy performance
- Market environment dependency: Strategy may underperform in markets lacking clear trends
- Signal lag: Some lag may exist due to moving average calculations
Strategy Optimization Directions
- Dynamic take-profit/stop-loss: Adjust levels based on market volatility
- Volume indicator integration: Enhance signal reliability through volume confirmation
- Market environment filtering: Add trend assessment module for different market conditions
- Parameter optimization: Use machine learning methods to optimize indicator parameter combinations
- Time filtering: Consider market time characteristics to avoid unfavorable trading periods
Summary
This is a quantitative trading strategy integrating multiple technical indicators, capturing market turning points through divergence signals. Its strengths lie in cross-validation of multiple indicators and comprehensive risk control system, while attention must be paid to false breakouts and parameter optimization. Through continuous optimization and improvement, the strategy shows promise for maintaining stable performance across different market environments.
- 1