
Overview
This strategy is a technical indicator-based swing trading system that combines multiple signals including moving average crossovers, RSI overbought/oversold conditions, and ATR-based stop-loss/take-profit levels. The core mechanism relies on capturing market trends through short-term EMA and long-term SMA crossovers, confirmed by RSI signals, with dynamic stop-loss and take-profit levels set using ATR. The strategy supports both long and short trading directions and allows flexible enabling/disabling of either direction.
Strategy Principles
The strategy employs a multi-layer technical indicator approach:
- Trend Determination Layer: Uses 20-period EMA and 50-period SMA crossovers to determine trend direction, with EMA crossing above SMA as long signal and below as short signal.
- Momentum Confirmation Layer: Uses RSI indicator for overbought/oversold confirmation, allowing longs below RSI 70 and shorts above RSI 30.
- Volatility Calculation Layer: Uses 14-period ATR to calculate stop-loss and take-profit levels, setting stop-loss at 1.5x ATR and take-profit at 3x ATR.
- Position Management Layer: Dynamically calculates position size based on initial capital and per-trade risk percentage (default 1%).
Strategy Advantages
- Multiple Signal Confirmation: Reduces false signals through the combination of moving average crossovers, RSI, and ATR indicators.
- Dynamic Stop-Loss/Take-Profit: Adapts to changing market volatility through ATR-based position management.
- Flexible Trading Direction: Allows independent enabling of long or short trades based on market conditions.
- Strict Risk Control: Effectively controls risk exposure through percentage-based risk control and dynamic position sizing.
- Visualization Support: Provides comprehensive chart visualization including signal markers and indicator displays.
Strategy Risks
- Sideways Market Risk: Moving average crossovers may generate excessive false signals in ranging markets.
- Slippage Risk: Actual execution prices may significantly deviate from signal prices during volatile periods.
- Capital Management Risk: Excessive risk percentage settings may lead to large single-trade losses.
- Parameter Sensitivity: Strategy performance is sensitive to parameter settings, requiring careful optimization.
Strategy Optimization Directions
- Add Trend Strength Filter: Implement ADX indicator to filter trades in weak trend environments.
- Optimize Moving Average Periods: Dynamically adjust moving average parameters based on market cycle characteristics.
- Enhance Stop-Loss Mechanism: Add trailing stop-loss functionality to better protect profits.
- Add Volume Confirmation: Incorporate volume indicators as additional confirmation to improve signal reliability.
- Market Environment Classification: Add market environment recognition module to use different parameter sets in different market conditions.
Summary
The strategy constructs a relatively complete trading system through the combination of multiple technical indicators. Its strengths lie in signal confirmation reliability and comprehensive risk management, though market environment impact on strategy performance needs attention. Through the suggested optimization directions, there is significant room for improvement. When applying to live trading, thorough parameter testing and backtesting verification is recommended.
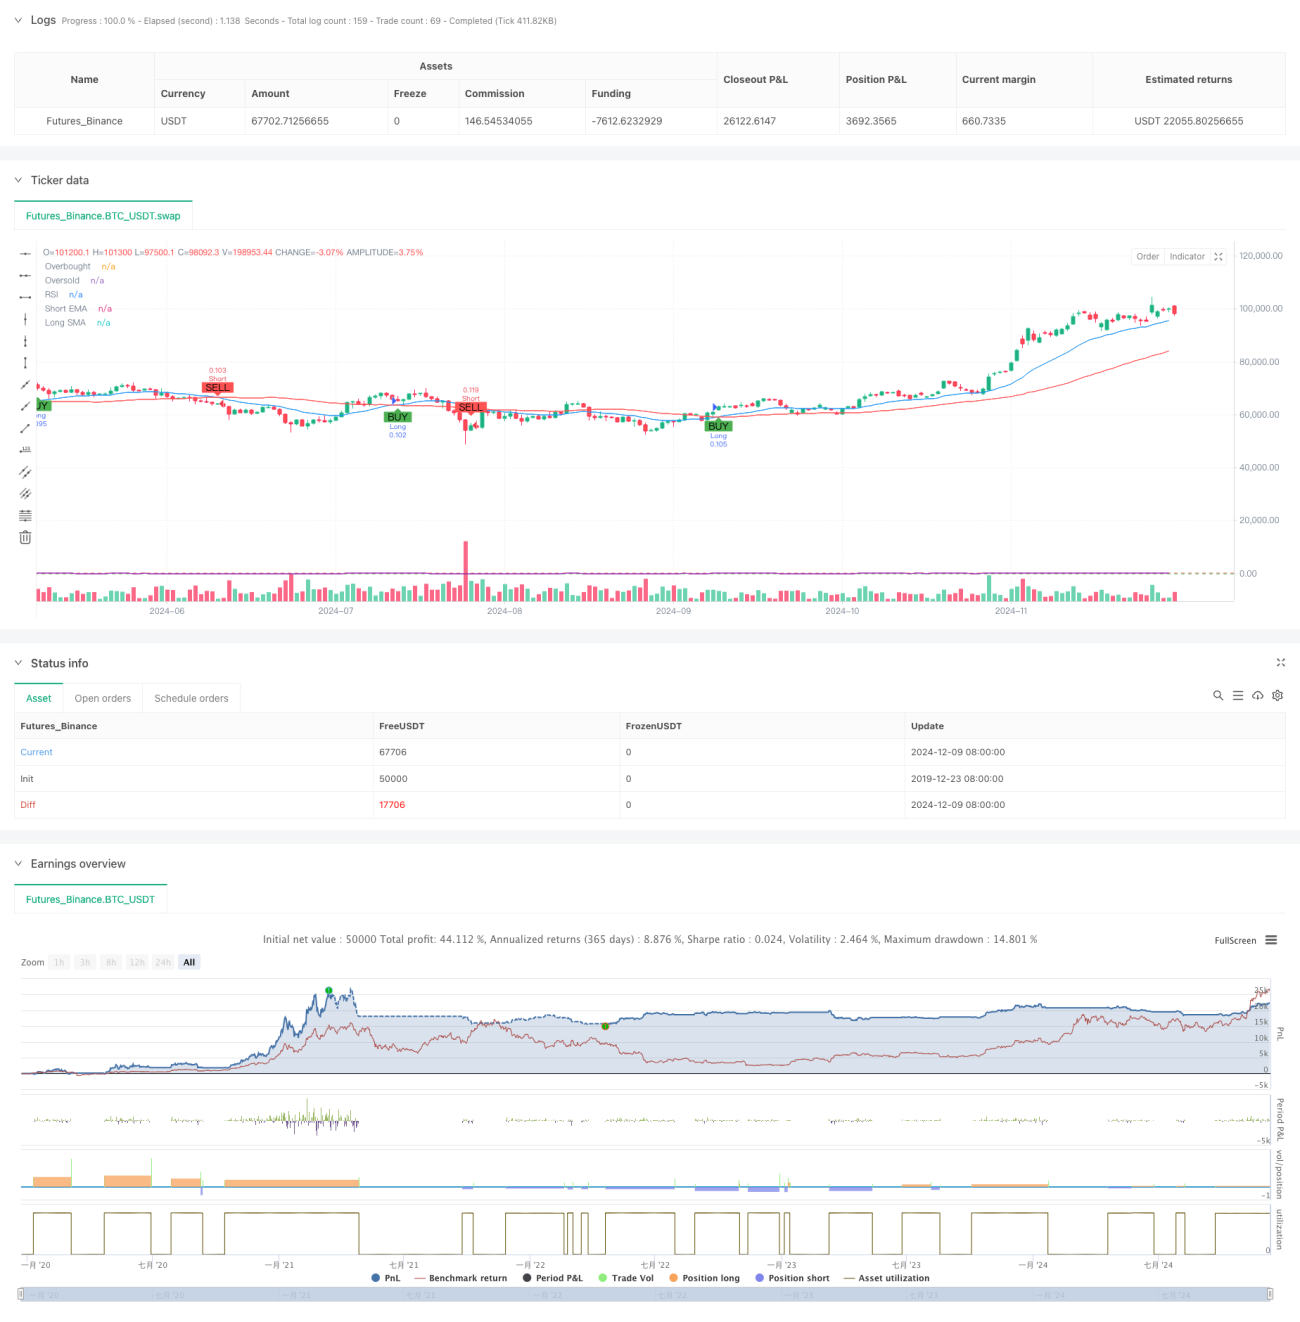
/*backtest
start: 2019-12-23 08:00:00
end: 2024-12-10 08:00:00
period: 1d
basePeriod: 1d
exchanges: [{"eid":"Futures_Binance","currency":"BTC_USDT"}]
*/

// This Pine Script™ code is subject to the terms of the Mozilla Public License 2.0 at https://mozilla.org/MPL/2.0/
// © CryptoRonin84

//@version=5- 1