Multi-Timeframe Trend Dynamic ATR Tracking Strategy

Overview
This strategy is an adaptive trend following system that combines multiple technical indicators. It optimizes trading performance through multi-timeframe analysis and dynamic adjustment of stop-loss and take-profit levels. The core of the strategy uses a moving average system to identify trends, RSI and MACD to confirm trend strength, and ATR for dynamic risk management parameter adjustment.
Strategy Principles
The strategy employs a triple verification mechanism for trading: 1) Trend direction is determined by fast/slow EMA crossovers; 2) Trading signals are filtered using RSI overbought/oversold levels and MACD trend confirmation; 3) Higher timeframe EMA is incorporated for trend confirmation. For risk control, the strategy dynamically adjusts stop-loss and profit targets based on ATR, achieving adaptive position management. When market volatility increases, the system automatically expands stop-loss and profit spaces; when markets stabilize, these parameters are narrowed to improve win rates.
Strategy Advantages
- Multi-dimensional signal verification mechanism significantly improves trading accuracy
- Adaptive stop-loss and take-profit settings better accommodate different market environments
- Higher timeframe trend confirmation effectively reduces false breakout risks
- Comprehensive alert system helps capture trading opportunities and risk control timely
- Flexible trading direction settings allow strategy adaptation to different trading preferences
Strategy Risks
- Multiple verification mechanisms may miss opportunities in rapid market movements
- Dynamic stop-loss might trigger prematurely in highly volatile markets
- False signals may occur frequently in range-bound markets
- Risk of overfitting during parameter optimization
- Multi-timeframe analysis may produce conflicting signals across different timeframes
Optimization Directions
- Incorporate volume indicators as auxiliary confirmation to improve signal reliability
- Develop a quantitative trend strength scoring system to optimize entry timing
- Implement adaptive parameter optimization mechanisms to enhance strategy stability
- Add market environment classification system to apply different parameters for different markets
- Develop dynamic position management system to adjust position size based on signal strength
Summary
This is a rigorously designed trend following system that provides a comprehensive trading solution through multi-level verification mechanisms and dynamic risk management. The strategy's core strengths lie in its adaptability and risk control capabilities, but attention must be paid to parameter optimization and market environment matching during implementation. Through continuous optimization and refinement, this strategy has the potential to maintain stable performance across different market environments.
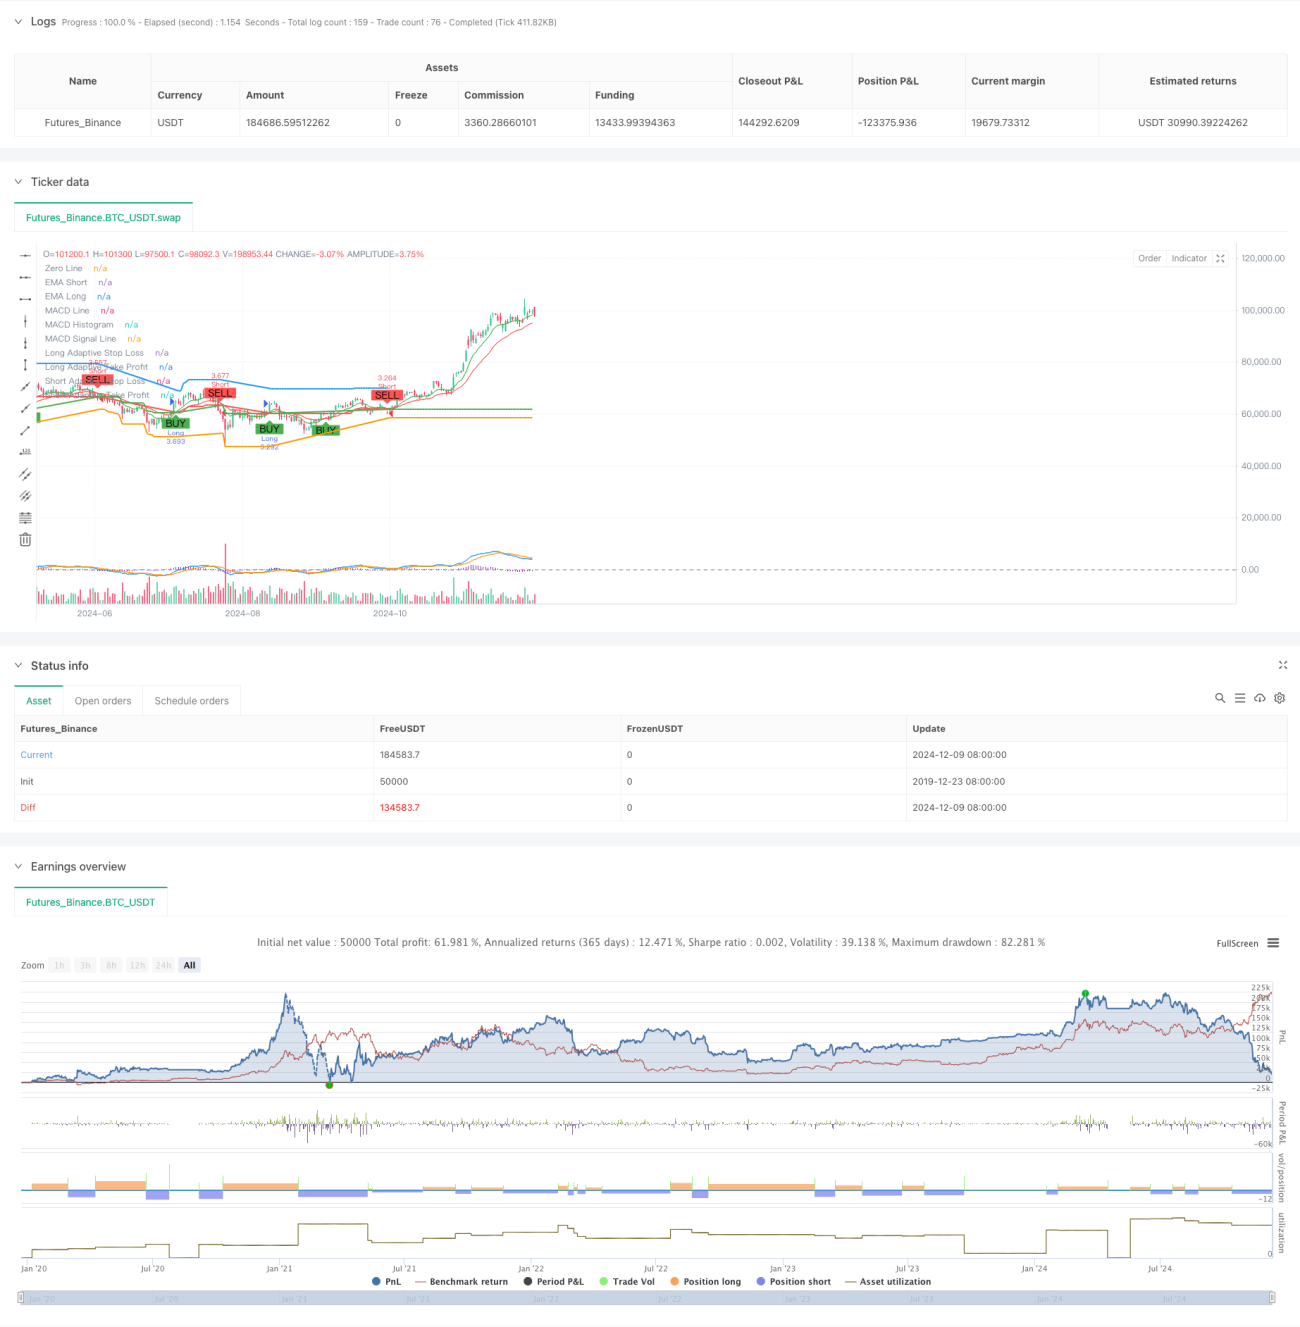
/*backtest
start: 2019-12-23 08:00:00
end: 2024-12-10 08:00:00
period: 1d
basePeriod: 1d
exchanges: [{"eid":"Futures_Binance","currency":"BTC_USDT"}]
*/

//@version=5
strategy("TrenGuard Adaptive ATR Strategy", overlay=true, default_qty_type=strategy.percent_of_equity, default_qty_value=100)

// Parameters- 1