Multi-Equilibrium Price Trend Following and Reversal Trading Strategy

Strategy Overview
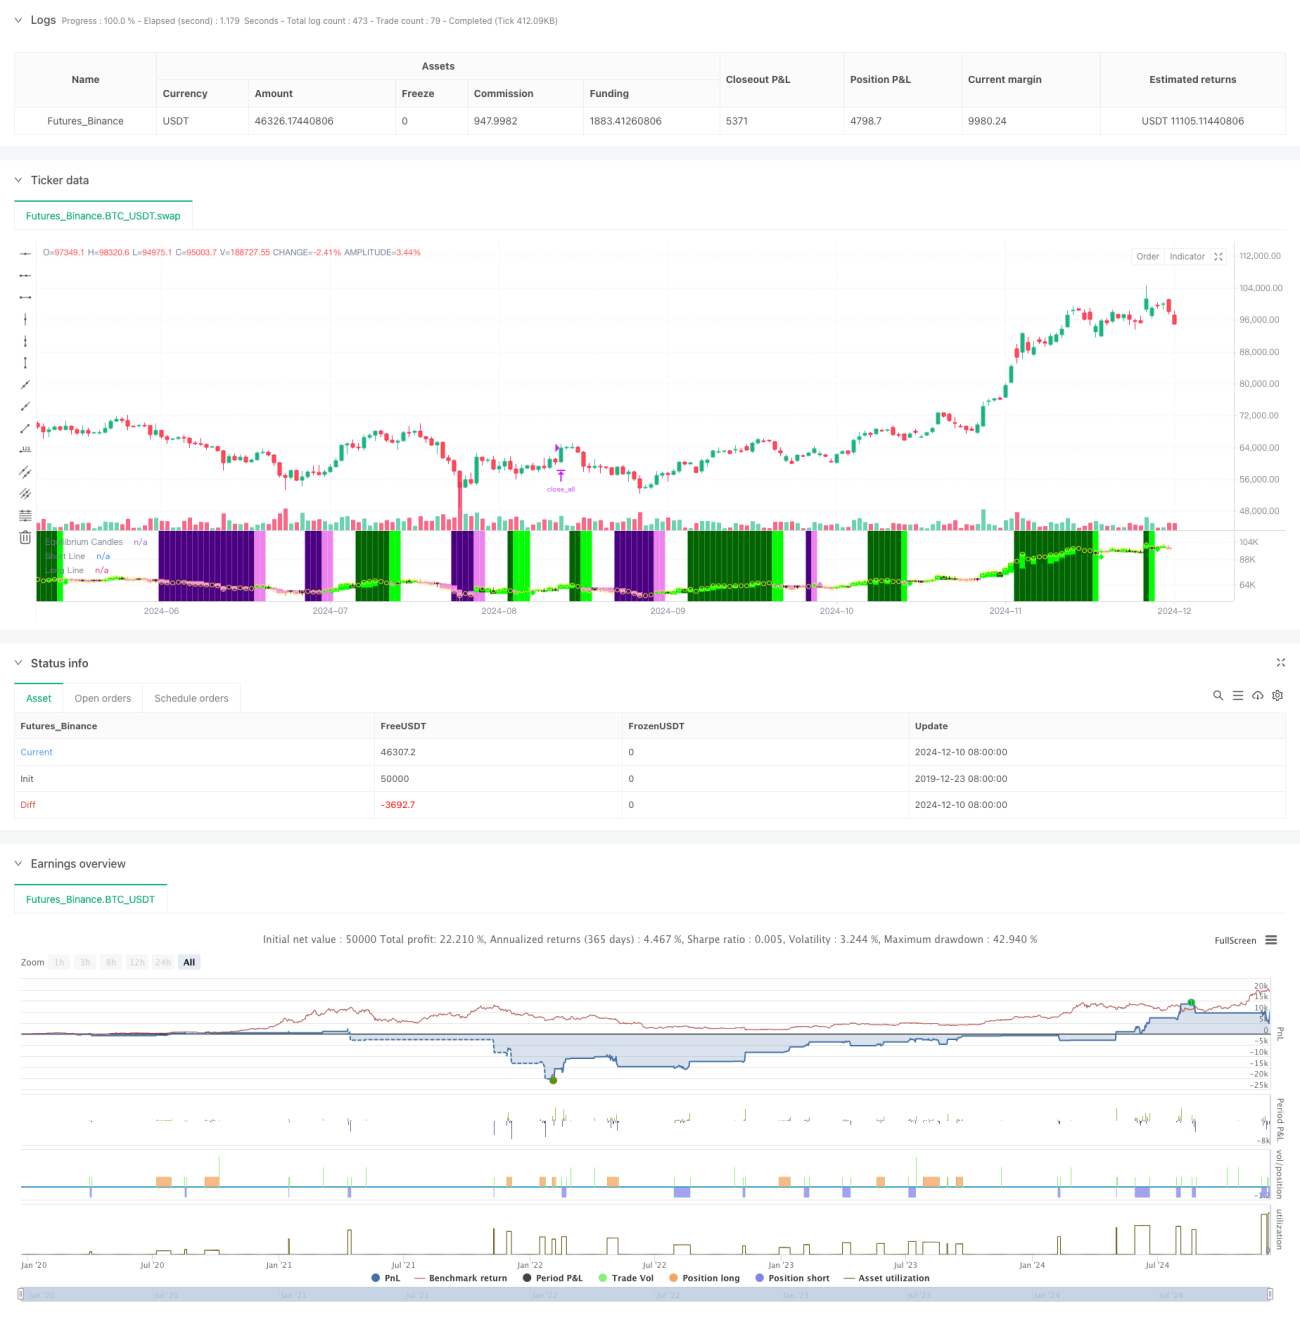
This strategy is a trend following and reversal trading system based on price equilibrium points. It determines the equilibrium price by calculating the midpoint between the highest and lowest points over X bars, and judges trend direction based on the closing price's position relative to the equilibrium price. When price maintains on one side of the equilibrium for a set number of bars, the system confirms a trend. It seeks entry opportunities on the first pullback (price crossing equilibrium). The strategy can be configured for either trend following or reversal trading modes.
Strategy Principles
- Equilibrium Price Calculation: Uses the midpoint between the highest and lowest prices over X bars as equilibrium price, identical to the baseline calculation in Ichimoku Cloud.
- Trend Determination: A trend is confirmed when price stays on the same side of equilibrium for X consecutive bars (default 7).
- Entry Signals: Triggers entry on first pullback (price crossing equilibrium) after trend confirmation.
- Stop Loss and Take Profit: Uses 60th percentile of ATR for dynamic adjustment of stop loss and take profit distances, providing flexible risk control.
- Large Movement Protection: Automatically closes positions when price deviates from equilibrium beyond a set ATR multiple.
Strategy Advantages
- High Adaptability: Flexibly switches between trend following and reversal trading modes based on market characteristics.
- Comprehensive Risk Control: Employs dynamic ATR stops and large movement protection mechanisms.
- Clear Operations: Trading signals are clear and don't rely on complex technical indicator combinations.
- Good Visualization: Uses colored candlesticks and backgrounds for intuitive market state display.
- Automation Friendly: Easily interfaces with trading platforms like MT5 for automated trading.
Strategy Risks
- Choppy Market Risk: May generate frequent false signals in sideways markets.
- Slippage Impact: May face significant slippage during violent market movements.
- Parameter Sensitivity: Core parameters like equilibrium period and trend determination period need careful optimization for different markets.
- Market Transition Risk: Transitions from trending to ranging markets may cause significant drawdowns.
Strategy Optimization Directions
- Market Environment Recognition: Add market environment identification module to dynamically adjust strategy parameters under different market conditions.
- Signal Filtering: Consider adding volume, volatility, and other auxiliary indicators to filter false signals.
- Position Management: Introduce more sophisticated position management mechanisms, such as volatility-based dynamic adjustment.
- Multiple Timeframes: Integrate signals from multiple timeframes to improve trading accuracy.
- Trading Cost Optimization: Optimize entry and exit timing based on cost characteristics of different trading instruments.
Summary
This is a well-designed trend trading system that provides clear trading logic through the core concept of equilibrium price. The strategy's greatest strength is its flexibility, being suitable for both trend following and reversal trading while maintaining comprehensive risk control mechanisms. Although it may face challenges under certain market conditions, through continuous optimization and flexible adjustment, the strategy has the potential to maintain stable performance across various market environments.
- 1