Historical High Breakthrough with Monthly Moving Average Filter Trend Following Strategy

Overview
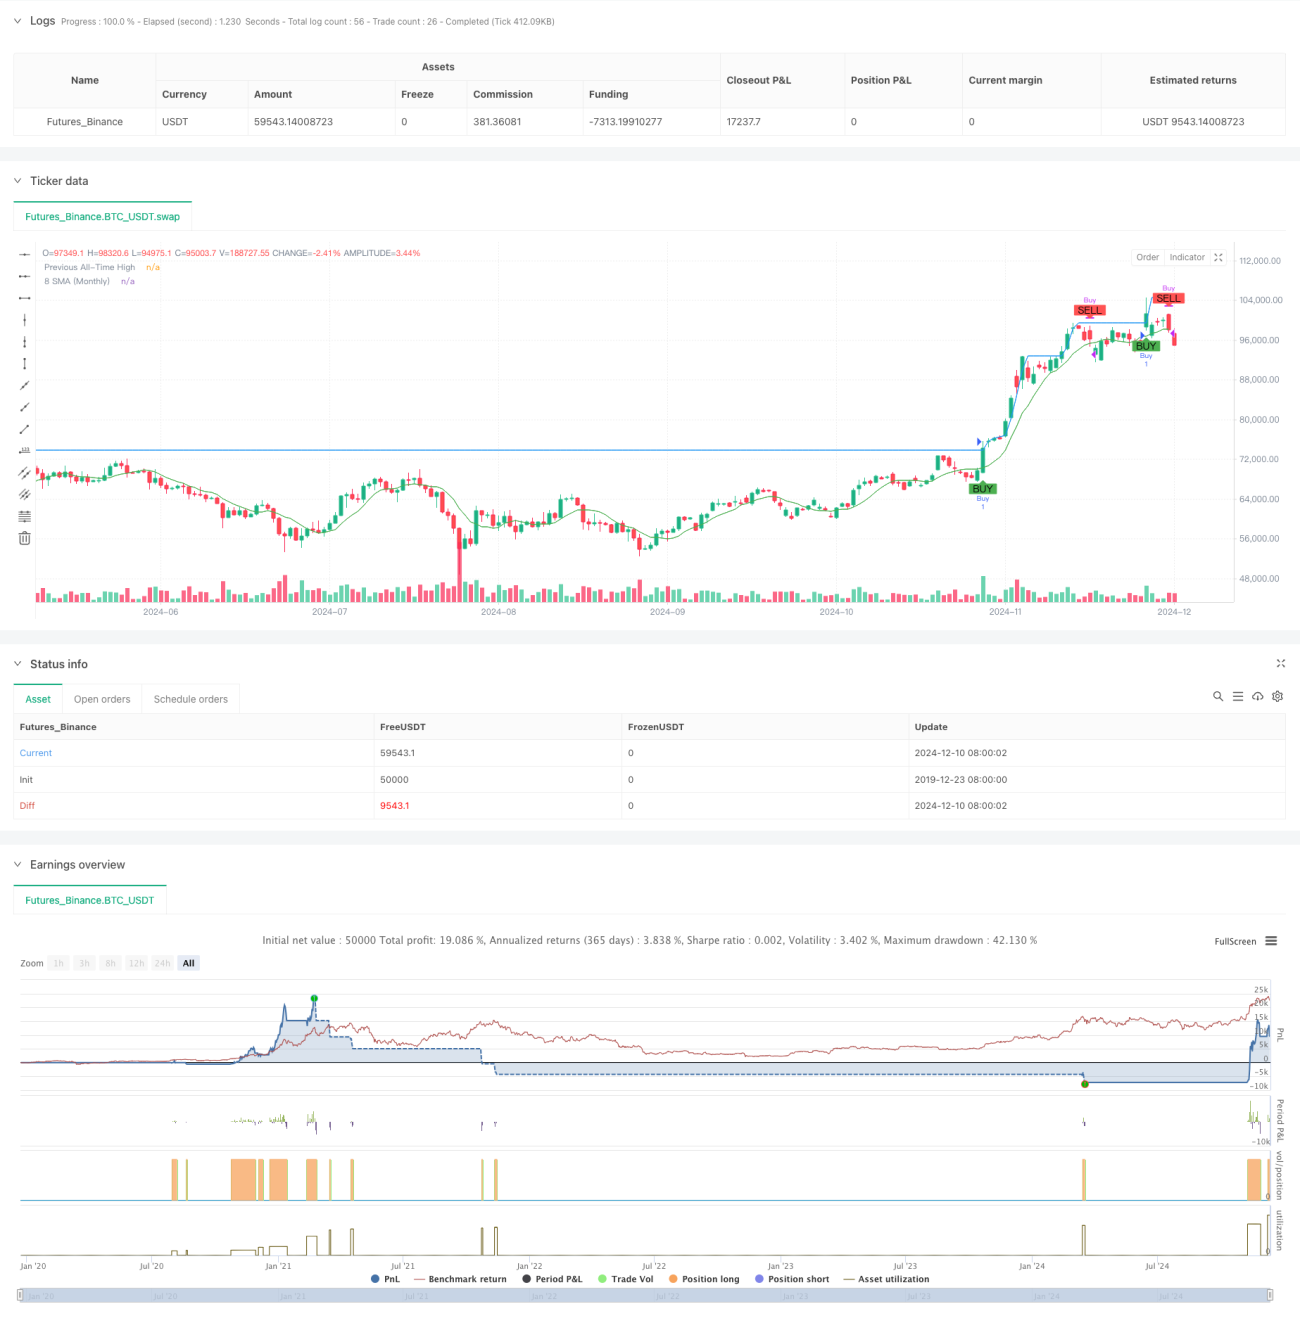
This strategy is a trend following system based on historical high breakthrough and monthly moving average filter. It generates buy signals by monitoring price breakouts above previous historical highs, while using the 8-period Simple Moving Average (8 SMA) on monthly timeframe as a sell filter to reduce false breakout risks. The strategy design aligns with the market characteristic of "trend continuation" and is particularly suitable for capturing major trends in strong upward markets.
Strategy Principles
The core logic consists of two key components:
- Buy Signal: Generated when the latest closing price breaks above the previous historical high (excluding the current bar's high). This condition ensures entry only in clear upward trends.
- Sell Signal: Triggered when the monthly closing price falls below the 8-period Simple Moving Average. This condition helps with timely stop-loss and prevents larger losses from trend reversals.
The strategy also includes a signal state tracking mechanism to avoid repeated signals in the same state, improving strategy stability.
Strategy Advantages
- Strong Trend Capture: Effectively captures strong upward trends through historical high breakout detection.
- Robust Risk Control: Incorporates monthly moving average as a filter to effectively screen out false breakouts.
- High Signal Stability: Uses lastSignal variable to track signal states, preventing signal repetition.
- Good Visualization: Provides clear graphical interface including historical high lines, moving averages, and buy/sell markers.
- High Adaptability: Can be applied to different timeframes and instruments.
Strategy Risks
- Lag Risk: Historical high breakout signals are inherently somewhat lagging, potentially missing optimal entry points.
- False Breakout Risk: Despite monthly moving average filtering, false breakouts may still occur in ranging markets.
- Drawdown Risk: Strategy may experience significant drawdowns at trend reversal points.
- Position Management Risk: Strategy lacks position sizing mechanisms, requiring additional money management rules.
Strategy Optimization Directions
- Volume Confirmation: Add volume indicators as breakout confirmation conditions to improve signal reliability.
- Enhanced Stop-Loss: Design more flexible stop-loss rules, such as trailing stops or volatility-based stops.
- Position Management: Dynamically adjust position sizes based on market volatility and trend strength.
- Signal Filtering: Add trend strength indicators like ADX to further filter weak signals.
- Time Filtering: Add time period filters to avoid trading during unsuitable time periods.
Summary
This is a well-designed trend following strategy with clear logic. Through the combination of historical high breakouts and monthly moving averages, it achieves both effective trend capture and reasonable risk control. While there are inherent risks of lag and false breakouts, the suggested optimization directions offer potential for further performance improvement. The strategy is particularly suitable for markets with clear trends and can serve as an important reference tool for medium to long-term investment.
- 1