Dynamic EMA Trend Crossover Entry Quantitative Strategy

Overview
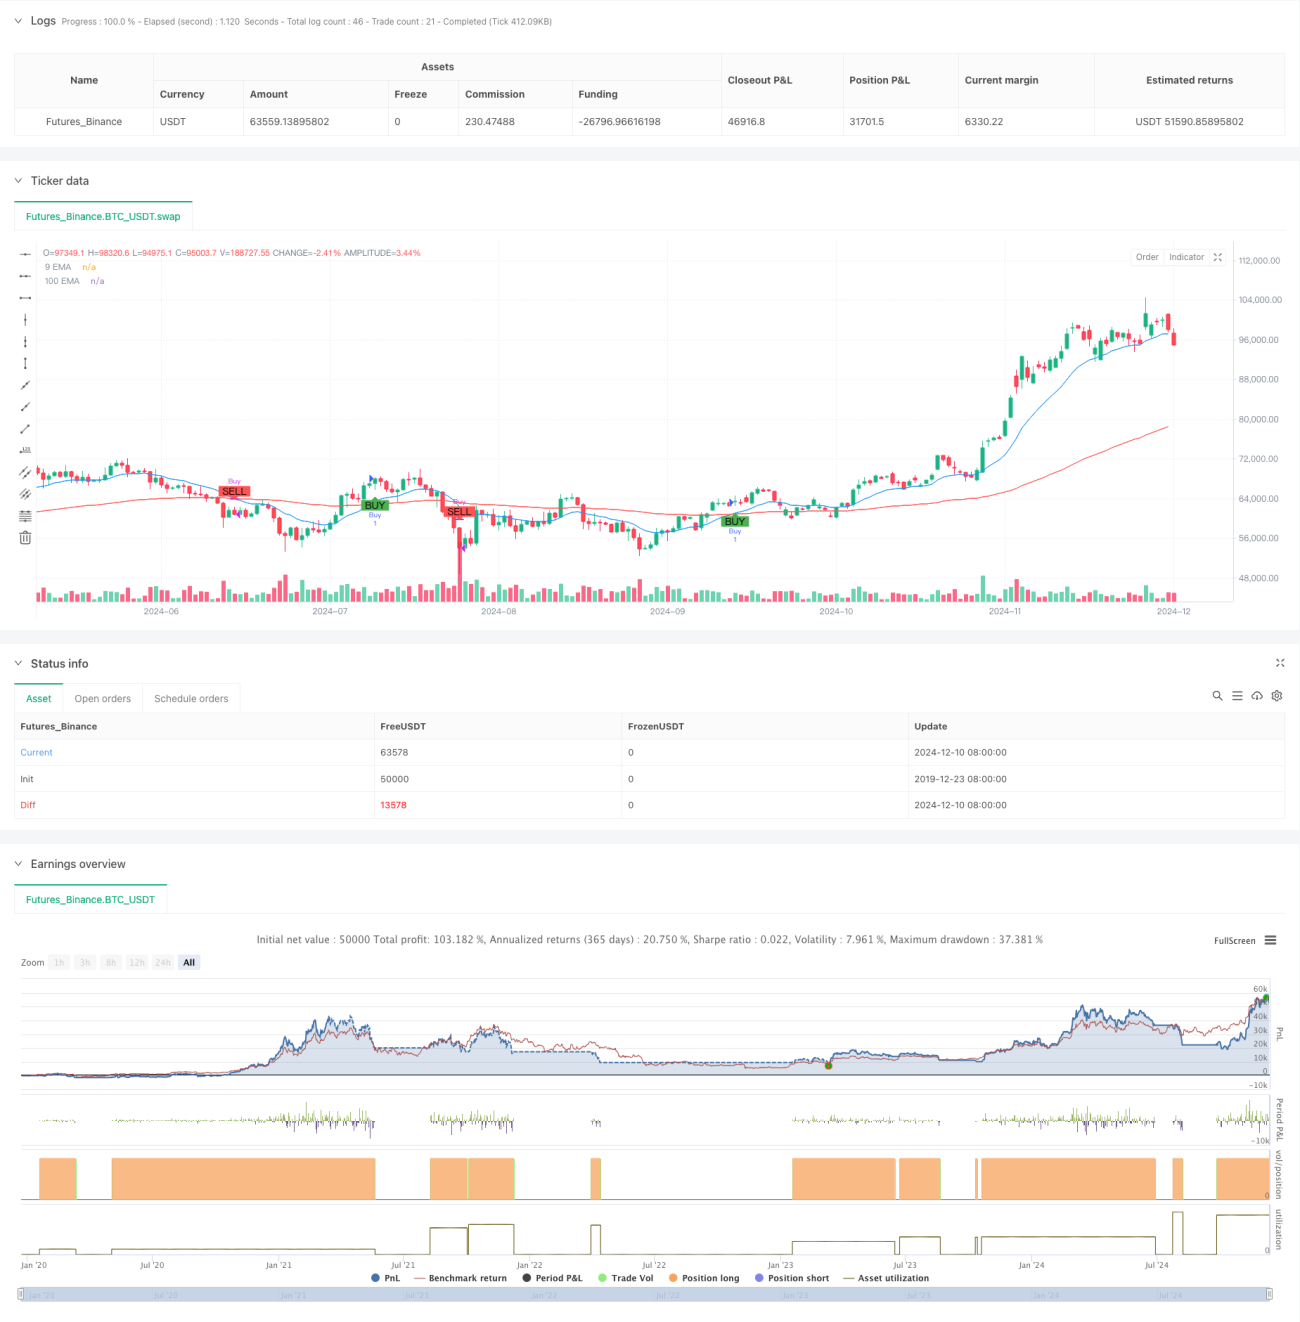
This strategy is a quantitative trading system based on the crossover of dual Exponential Moving Averages (EMA). It utilizes a short-term EMA (14 periods) and a long-term EMA (100 periods) to capture market trend transition points by determining entry timing through the intersection of short-term and long-term moving averages. Buy signals are generated when the short-term EMA crosses above the long-term EMA, and sell signals are generated when the opposite occurs. This strategy is particularly suitable for traders looking to position themselves at the beginning of trend reversals.
Strategy Principles
The core logic of the strategy is built on momentum changes in price trends. The short-term EMA is more sensitive to price changes, while the long-term EMA better filters market noise and reflects the primary trend. When the short-term moving average crosses above the long-term moving average, it indicates strengthening short-term momentum and a possible uptrend; when the short-term moving average crosses below the long-term moving average, it suggests weakening momentum and a potential downtrend. The strategy uses ta.crossover and ta.crossunder functions to accurately capture these crossing points and execute position operations at appropriate times.
Strategy Advantages
- Clear and simple operational logic, easy to understand and execute
- Effectively captures trend initiation points, capitalizing on major market movements
- Good risk control capability through automatic stop-loss using moving average crossovers
- Utilizes EMA's dynamic characteristics for faster response to price changes
- Supports customizable parameters for optimization based on different market characteristics
- Features automated execution capability, reducing emotional interference
Strategy Risks
- May generate frequent false signals in choppy markets
- Moving average crossovers have inherent lag, potentially missing optimal entry points
- Possible significant drawdowns in rapidly volatile markets
- Improper parameter selection may lead to decreased signal quality
- Need to consider the impact of trading costs on strategy returns
Strategy Optimization Directions
- Incorporate volume indicators as confirmatory signals
- Add trend strength filters to reduce false breakout risks
- Optimize moving average period parameters for specific markets
- Implement dynamic stop-loss mechanisms to enhance risk control
- Integrate other technical indicators to improve signal reliability
- Develop adaptive parameter mechanisms to enhance strategy adaptability
Summary
The Dynamic EMA Trend Crossover Entry Quantitative Strategy is a classic and practical trend-following system. By combining short-term and long-term exponential moving averages, the strategy effectively captures market trend transition opportunities. While there are risks of lag and false signals, stable trading results can still be achieved through appropriate parameter optimization and risk control measures. The strategy's simplicity and scalability make it an excellent foundation framework for quantitative trading.
- 1