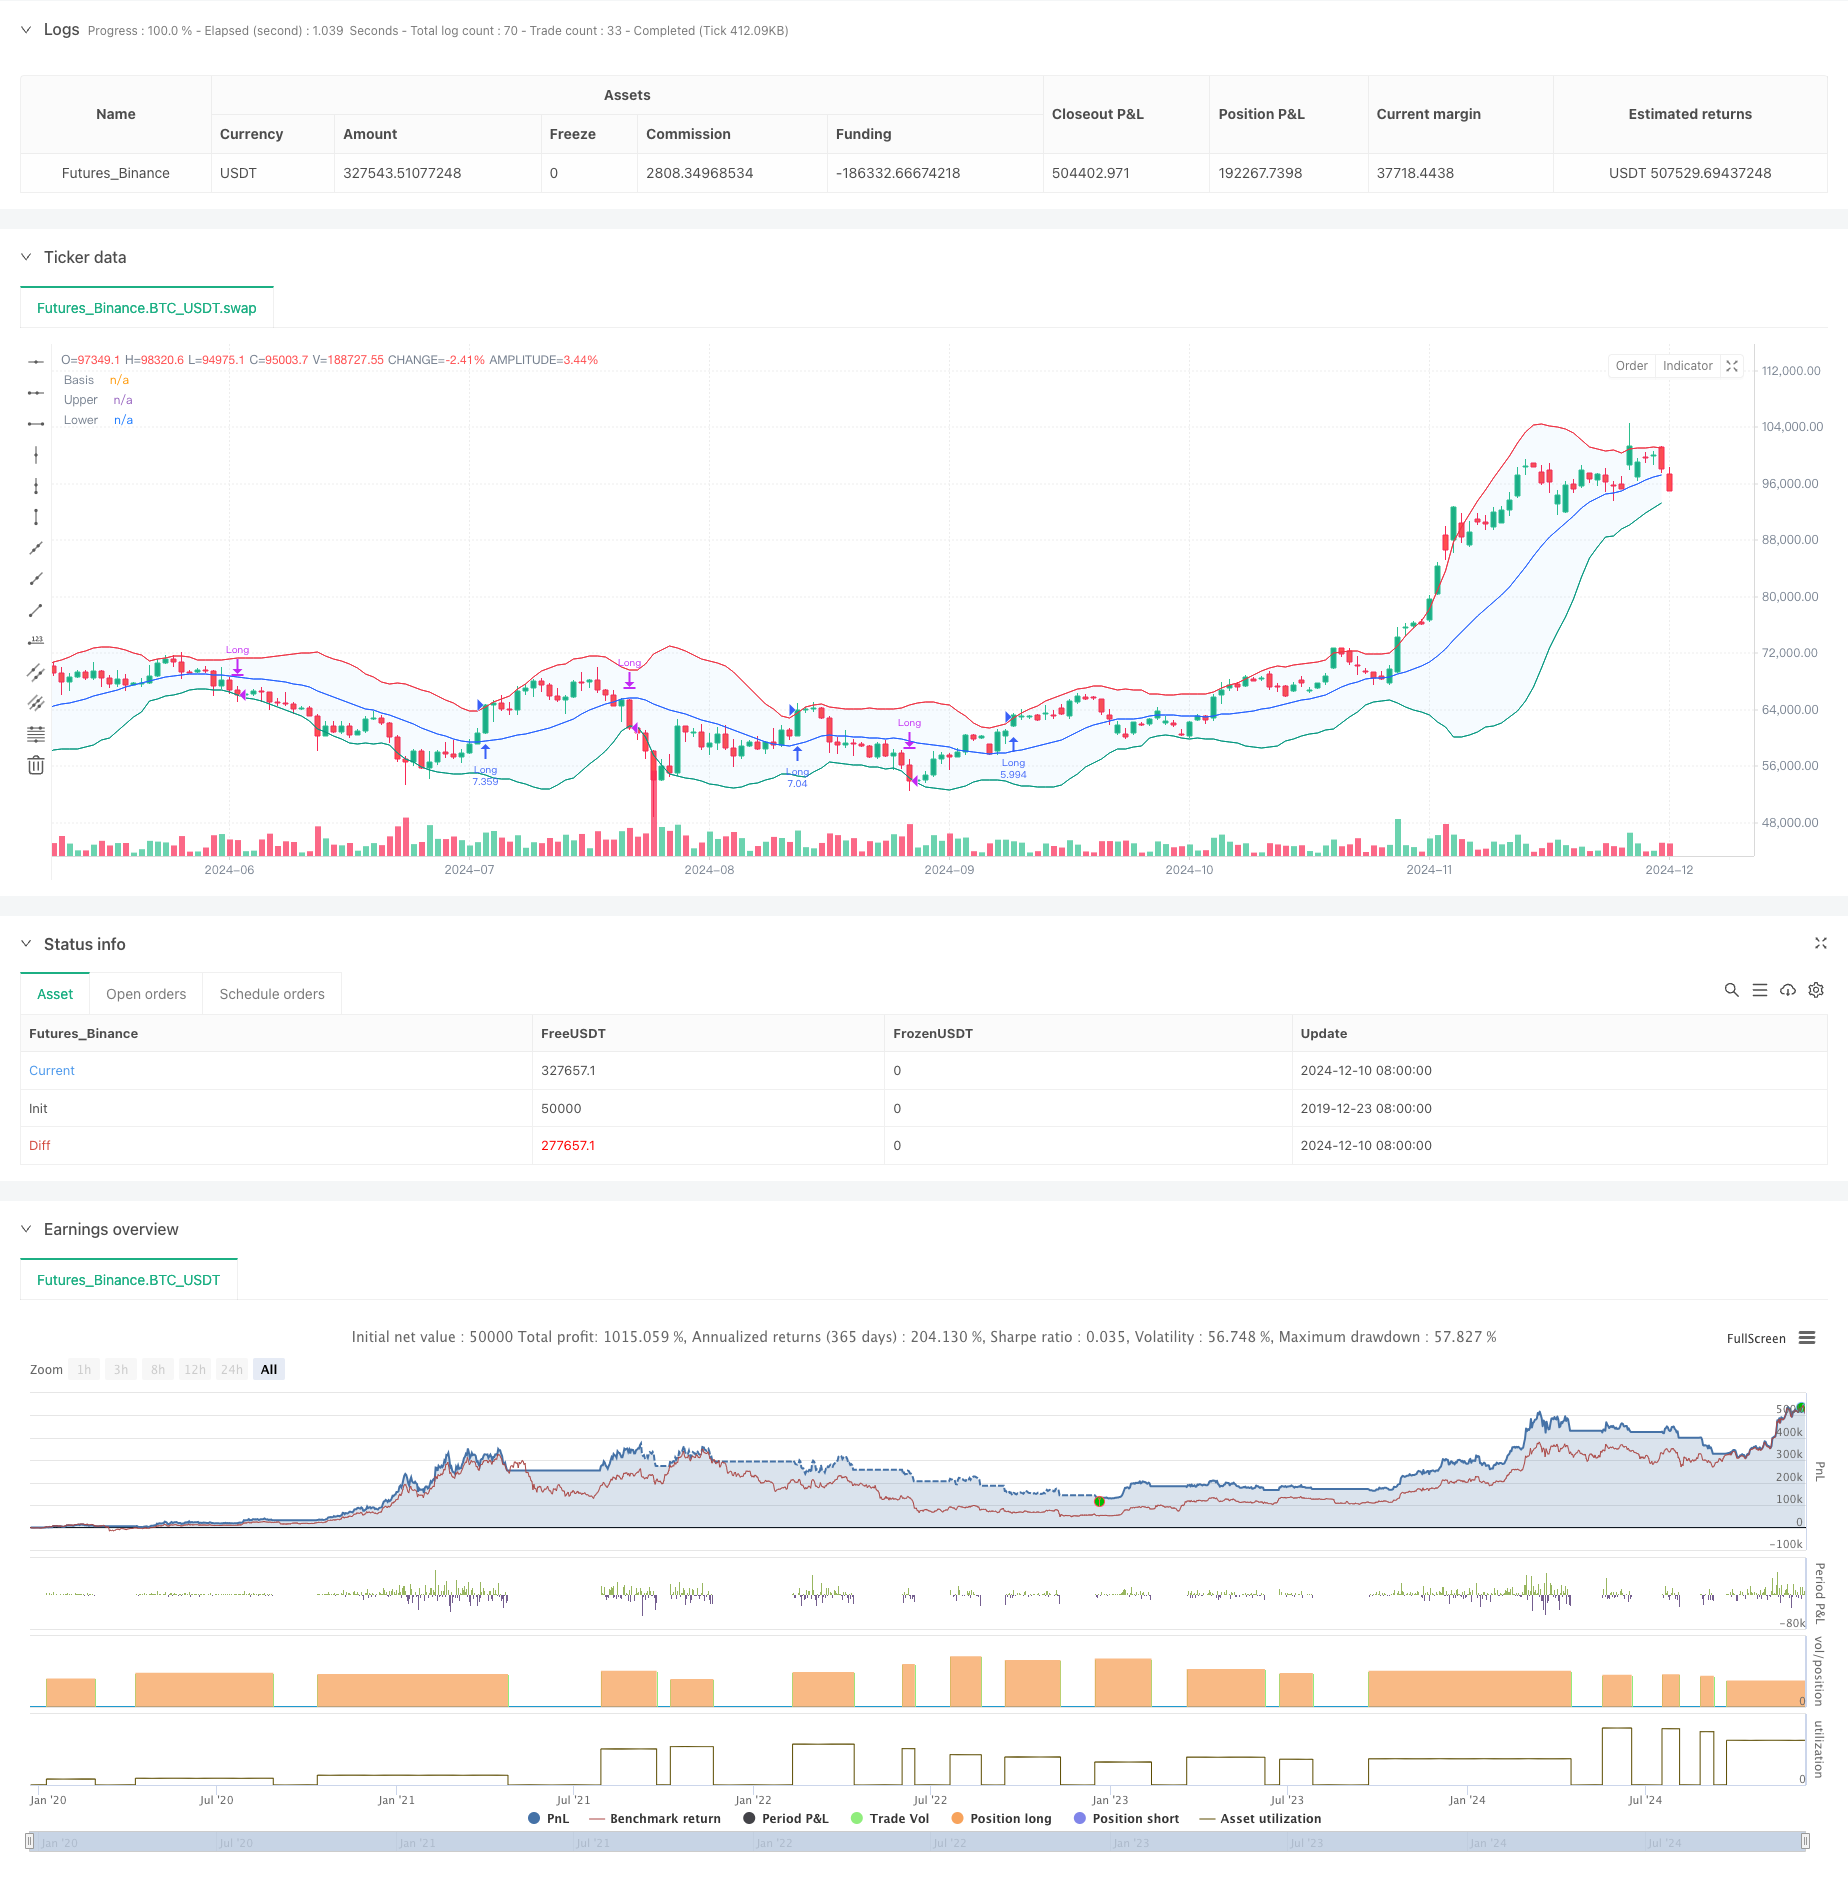
概述
该策略是一个基于波林格带(Bollinger Bands)的动量突破交易系统,主要通过价格与波林格带上轨的关系来捕捉趋势性机会。策略采用了自适应的均线类型选择机制,结合标准差通道来识别市场波动特征,特别适合在波动性较大的市场环境中应用。
策略原理
策略的核心逻辑基于以下几个关键要素: 1. 使用可自定义的移动平均线(包括SMA、EMA、SMMA、WMA、VWMA)计算波林格带的中轨。 2. 通过标准差的倍数(默认2.0)动态确定上下轨的位置。 3. 在价格突破上轨时入场做多,表明强势突破趋势的形成。 4. 当价格跌破下轨时平仓出场,说明上升趋势可能已经结束。 5. 系统内置了交易成本(0.1%)和滑点(3个点)的考虑,更符合实际交易环境。
策略优势
- 适应性强:通过多种均线类型的选择,策略可以适应不同市场条件。
- 风险控制完善:通过波林格带下轨作为止损点,提供了明确的风险控制。
- 资金管理合理:采用仓位比例管理方式,避免了固定手数带来的风险。
- 交易成本考虑充分:包含了佣金和滑点因素,回测结果更接近实际。
- 时间框架灵活:可以通过参数设置选择特定的交易时间范围。
策略风险
- 假突破风险:在震荡市场中可能出现频繁的假突破信号。 解决方案:可以增加确认指标或延迟进场机制。
- 趋势反转风险:在强趋势市场突然反转时可能造成较大损失。 解决方案:可以添加趋势强度过滤器。
- 参数敏感性:不同的参数组合可能导致策略表现差异较大。 解决方案:需要进行充分的参数优化和稳健性测试。
策略优化方向
- 引入趋势强度指标:
- 可以添加ADX或类似指标来过滤弱趋势市场的信号
- 这样可以减少假突破带来的损失
- 优化止损机制:
- 可以实现动态止损,如跟踪止损
- 有助于在趋势持续时获得更大收益
- 增加交易过滤器:
- 基于成交量的确认信号
- 避免在低流动性环境下交易
- 完善进场机制:
- 可以增加回调入场的机制
- 有助于获得更好的入场价格
总结
这是一个设计合理、逻辑清晰的趋势跟踪策略。它通过波林格带的动态特性捕捉市场动量,并具备良好的风险控制机制。策略的可定制性强,通过参数调整可以适应不同的市场环境。建议在实盘应用时进行充分的参数优化和回测验证,并结合建议的优化方向进行策略改进。
策略源码
/*backtest
start: 2019-12-23 08:00:00
end: 2024-12-11 08:00:00
period: 1d
basePeriod: 1d
exchanges: [{"eid":"Futures_Binance","currency":"BTC_USDT"}]
*/

//@version=5
strategy("Demo GPT - Bollinger Bands", overlay=true, initial_capital=10000, commission_type=strategy.commission.percent, commission_value=0.1, slippage=3, default_qty_type=strategy.percent_of_equity, default_qty_value=100)

// Inputs
length = input.int(20, minval=1, title="Length")
maType = input.string("SMA", "Basis MA Type", options = ["SMA", "EMA", "SMMA (RMA)", "WMA", "VWMA"])
src = input(close, title="Source")
mult = input.float(2.0, minval=0.001, maxval=50, title="StdDev")
offset = input.int(0, "Offset", minval=-500, maxval=500)

// Date range inputs
startYear = input.int(2018, "Start Year", minval=1970, maxval=2100)
startMonth = input.int(1, "Start Month", minval=1, maxval=12)
startDay = input.int(1, "Start Day", minval=1, maxval=31)
endYear = input.int(2069, "End Year", minval=1970, maxval=2100)
endMonth = input.int(12, "End Month", minval=1, maxval=12)
endDay = input.int(31, "End Day", minval=1, maxval=31)

// Time range
startTime = timestamp("GMT+0", startYear, startMonth, startDay, 0, 0)
endTime = timestamp("GMT+0", endYear, endMonth, endDay, 23, 59)

// Moving average function
ma(source, length, _type) =>
    switch _type
        "SMA" => ta.sma(source, length)
        "EMA" => ta.ema(source, length)
        "SMMA (RMA)" => ta.rma(source, length)
        "WMA" => ta.wma(source, length)
        "VWMA" => ta.vwma(source, length)

// Calculate Bollinger Bands
basis = ma(src, length, maType)
dev = mult * ta.stdev(src, length)
upper = basis + dev
lower = basis - dev

// Plot
plot(basis, "Basis", color=#2962FF, offset=offset)
p1 = plot(upper, "Upper", color=#F23645, offset=offset)
p2 = plot(lower, "Lower", color=#089981, offset=offset)
fill(p1, p2, title="Background", color=color.rgb(33, 150, 243, 95))

// Strategy logic: Only go long and flat
inDateRange = time >= startTime and time <= endTime
noPosition = strategy.position_size == 0
longPosition = strategy.position_size > 0

// Buy if close is above upper band
if inDateRange and noPosition and close > upper
    strategy.entry("Long", strategy.long)

// Sell/Exit if close is below lower band
if inDateRange and longPosition and close < lower
    strategy.close("Long")
相关推荐