多指标动态止损动量趋势交易策略

EMA RSI MACD BB ADX ATR SMA
创建日期: 2024-12-20 16:00:29 最后修改: 2024-12-20 16:00:29
复制: 1 点击次数: 173
avatar of ChaoZhang ChaoZhang
1
关注
1254
关注者

多指标动态止损动量趋势交易策略

概述

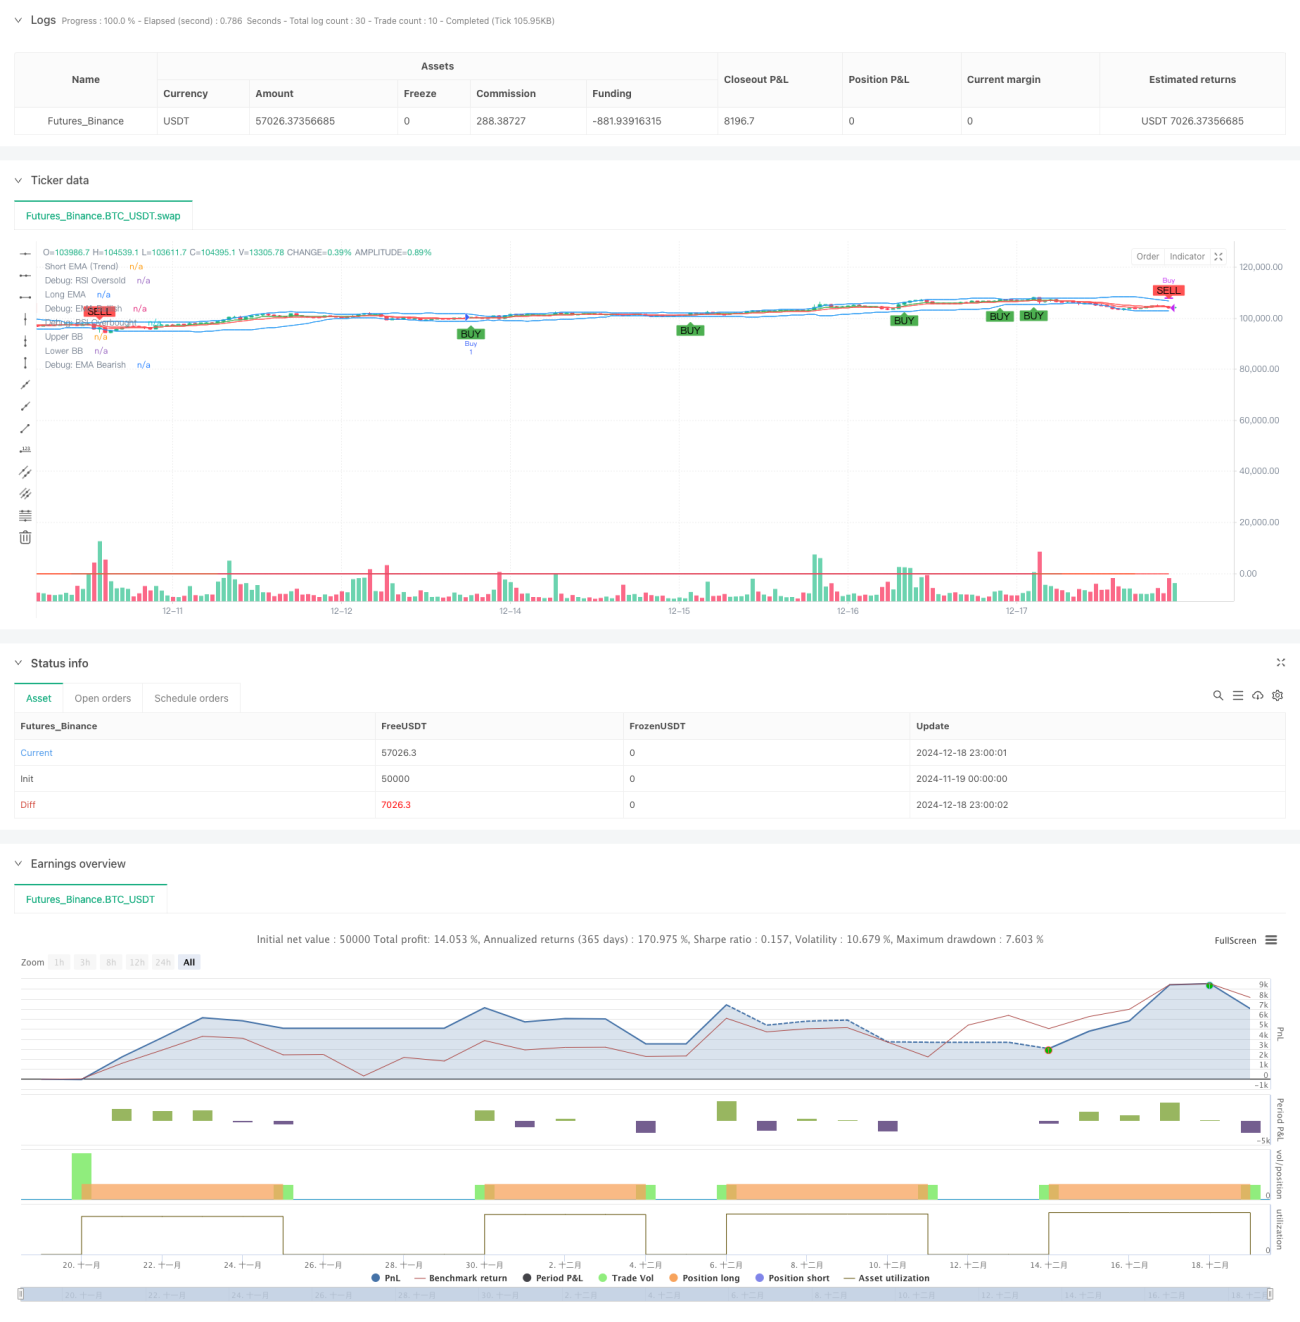
该策略是一个结合了多个技术指标的综合交易系统,主要通过动态监测市场动量和趋势变化来捕捉交易机会。策略整合了均线系统(EMA)、相对强弱指标(RSI)、移动平均收敛散度指标(MACD)、布林带(BB)等多个指标,并引入了基于真实波幅(ATR)的动态止损机制,实现了对市场多维度的分析和风险控制。

策略原理

策略采用多层次信号确认机制,主要包括以下几个方面: 1. 趋势判断:使用7周期和14周期EMA的交叉来确定市场趋势方向 2. 动量分析:通过RSI指标监测市场超买超卖状态,设定了30/70的动态阈值 3. 趋势强度确认:引入ADX指标判断趋势强度,当ADX>25时确认强趋势存在 4. 波动区间判断:运用布林带来界定价格波动区间,结合价格触及布林带情况产生交易信号 5. 成交量验证:使用动态成交量均线过滤,确保交易发生在足够的市场活跃度下 6. 风险控制:基于ATR指标设计的动态止损策略,止损距离为1.5倍ATR

策略优势

  1. 多维度信号验证,可以有效降低虚假信号
  2. 动态止损机制提高了策略的风险调适能力
  3. 结合成交量和趋势强度分析,提高了交易的可靠性
  4. 指标参数可调,具有良好的适应性
  5. 完整的进场和出场机制,交易逻辑清晰
  6. 采用标准技术指标,易于理解和维护

策略风险

  1. 多重指标可能导致信号滞后
  2. 参数优化可能存在过拟合风险
  3. 在横盘市场可能产生频繁交易
  4. 复杂的信号系统可能增加计算负担
  5. 需要较大的样本量来验证策略有效性

策略优化方向

  1. 引入市场波动率自适应机制,动态调整指标参数
  2. 增加时间过滤器,避免在不利时段交易
  3. 优化止盈策略,可考虑采用移动止盈
  4. 加入交易成本考虑,优化开平仓条件
  5. 引入位置管理机制,实现仓位动态调整

总结

该策略通过多指标协同配合,构建了一个较为完整的交易系统。核心优势在于多维度的信号确认机制和动态的风险控制系统,但也需要注意参数优化和市场适应性问题。通过持续优化和调整,该策略有望在不同市场环境下保持稳定的表现。

策略源码
/*backtest
start: 2024-11-19 00:00:00
end: 2024-12-19 00:00:00
period: 1h
basePeriod: 1h
exchanges: [{"eid":"Futures_Binance","currency":"BTC_USDT"}]
*/

//@version=5
strategy("XRP/USDT Scalping Strategy", overlay=true)

// Input Parameters
emaShortLength = input.int(7, title="Short EMA Length")
emaLongLength = input.int(14, title="Long EMA Length")
rsiLength = input.int(7, title="RSI Length")
rsiOverbought = input.int(70, title="RSI Overbought Level") // Adjusted to 70 for broader range
rsiOversold = input.int(30, title="RSI Oversold Level") // Adjusted to 30 for broader range
macdFastLength = input.int(12, title="MACD Fast Length")
macdSlowLength = input.int(26, title="MACD Slow Length")
macdSignalLength = input.int(9, title="MACD Signal Length")
bbLength = input.int(20, title="Bollinger Bands Length")
bbStdDev = input.float(2.0, title="Bollinger Bands Standard Deviation") // Adjusted to 2.0 for better signal detection

// EMA Calculation
emaShort = ta.ema(close, emaShortLength)
emaLong = ta.ema(close, emaLongLength)

// RSI Calculation
rsi = ta.rsi(close, rsiLength)

// MACD Calculation
[macdLine, signalLine, _] = ta.macd(close, macdFastLength, macdSlowLength, macdSignalLength)
macdHistogram = macdLine - signalLine

// Bollinger Bands Calculation
basis = ta.sma(close, bbLength)
deviation = ta.stdev(close, bbLength)
bbUpper = basis + (bbStdDev * (deviation > 1e-5 ? deviation : 1e-5)) // Ensure robust Bollinger Band calculation
bbLower = basis - bbStdDev * deviation

// Volume Condition
volCondition = volume > ta.sma(volume, input.int(20, title="Volume SMA Period")) // Dynamic volume filter

// Trend Strength (ADX)
// True Range Calculation
tr = math.max(high - low, math.max(math.abs(high - close[1]), math.abs(low - close[1])))
// Directional Movement
plusDM = high - high[1] > low[1] - low ? math.max(high - high[1], 0) : 0
minusDM = low[1] - low > high - high[1] ? math.max(low[1] - low, 0) : 0
// Smooth Moving Averages
atr_custom = ta.rma(tr, 14)
plusDI = 100 * ta.rma(plusDM, 14) / atr_custom // Correct reference to atr_custom
minusDI = 100 * ta.rma(minusDM, 14) / atr_custom // Correct reference to atr_custom
// ADX Calculation
adx = plusDI + minusDI > 0 ? 100 * ta.rma(math.abs(plusDI - minusDI) / (plusDI + minusDI), 14) : na // Simplified ternary logic for ADX calculation // Prevent division by zero // Prevent division by zero // Final ADX
strongTrend = adx > 25

// Conditions for Buy Signal
emaBullish = emaShort > emaLong
rsiOversoldCondition = rsi < rsiOversold
macdBullishCrossover = ta.crossover(macdLine, signalLine)
priceAtLowerBB = close <= bbLower

buySignal = emaBullish and (rsiOversoldCondition or macdBullishCrossover or priceAtLowerBB) // Relaxed conditions by removing volCondition and strongTrend

// Conditions for Sell Signal
emaBearish = emaShort < emaLong
rsiOverboughtCondition = rsi > rsiOverbought
macdBearishCrossover = ta.crossunder(macdLine, signalLine)
priceAtUpperBB = close >= bbUpper

sellSignal = emaBearish and (rsiOverboughtCondition or macdBearishCrossover or priceAtUpperBB) // Relaxed conditions by removing volCondition and strongTrend

// Plot EMA Lines
trendColor = emaShort > emaLong ? color.green : color.red
plot(emaShort, color=trendColor, title="Short EMA (Trend)") // Simplified color logic
plot(emaLong, color=color.red, title="Long EMA")

// Plot Bollinger Bands
plot(bbUpper, color=color.blue, title="Upper BB")
plot(bbLower, color=color.blue, title="Lower BB")

// Plot Buy and Sell Signals
plot(emaBullish ? 1 : na, color=color.green, linewidth=1, title="Debug: EMA Bullish")
plot(emaBearish ? 1 : na, color=color.red, linewidth=1, title="Debug: EMA Bearish")
plot(rsiOversoldCondition ? 1 : na, color=color.orange, linewidth=1, title="Debug: RSI Oversold")
plot(rsiOverboughtCondition ? 1 : na, color=color.purple, linewidth=1, title="Debug: RSI Overbought")
plotshape(series=buySignal, title="Buy Signal", location=location.belowbar, color=color.green, style=shape.labelup, text="BUY")
plotshape(series=sellSignal, title="Sell Signal", location=location.abovebar, color=color.red, style=shape.labeldown, text="SELL", size=size.small) // Dynamic size for signals

// Strategy Execution with ATR-based Stop Loss and Take Profit
// Reuse atr_custom from earlier calculation
stopLoss = low - (input.float(1.5, title="Stop Loss Multiplier") * atr_custom) // Consider dynamic adjustment based on market conditions // Adjustable stop-loss multiplier
takeProfit = close + (2 * atr_custom)

if (buySignal)
    strategy.entry("Buy", strategy.long, stop=stopLoss) // Removed limit to simplify trade execution

if (sellSignal)
    strategy.close("Buy")
相关推荐