Dynamic Wave-Trend Tracking Strategy

Overview
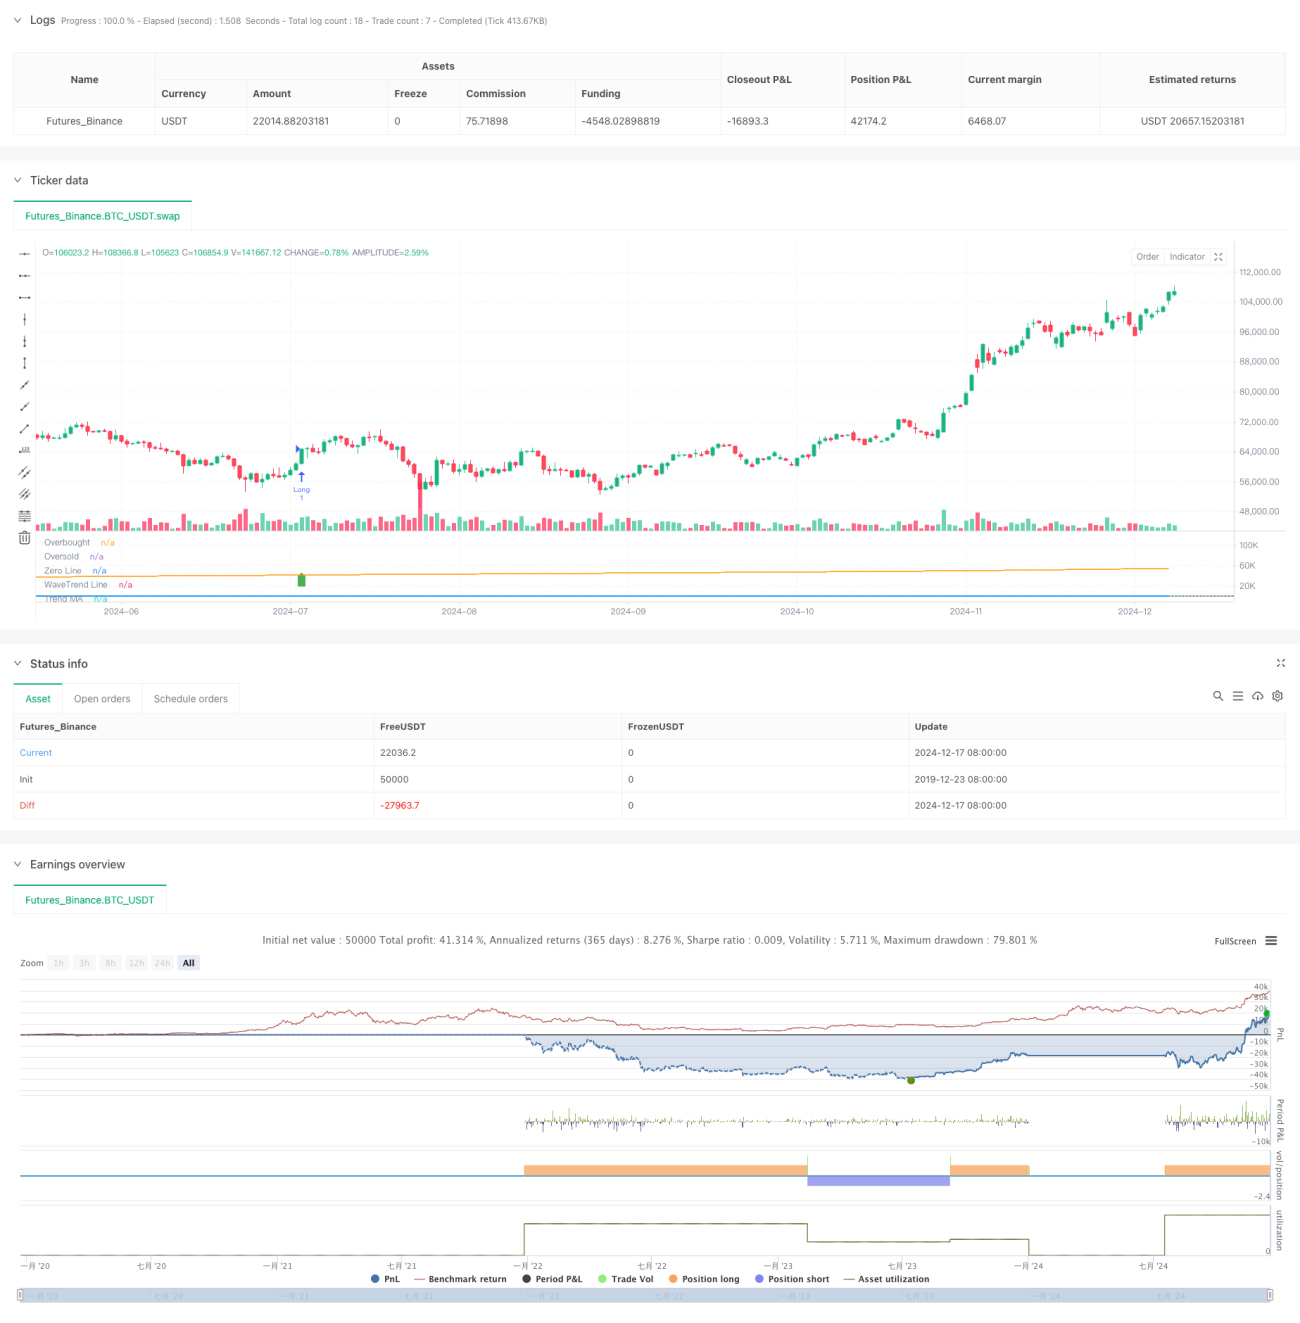
This strategy is a quantitative trading system based on the WaveTrend indicator and trend following. It combines the WaveTrend indicator with moving averages to form a complete trading decision framework. The strategy utilizes EMA and SMA to calculate wave trend values and overall market trends, identifies market turning points through overbought and oversold thresholds, and incorporates trend filters to improve trading accuracy.
Strategy Principle
The strategy's core is implemented through the following steps:
- Calculate HLC average price (average of high, low, and closing prices)
- Smooth the HLC average using EMA to obtain the ESA line
- Calculate and smooth the deviation between HLC average and ESA line using EMA
- Calculate K value based on deviation and smooth twice with EMA to get the final TCI line
- Use SMA to calculate long-term trend line as trend filter
- Generate trading signals when TCI line breaks through overbought/oversold levels and aligns with trend direction
Strategy Advantages
- High signal reliability: Effectively reduces false signals by combining WaveTrend indicator and trend filter
- Comprehensive risk control: Clear overbought/oversold thresholds for timely stop-loss
- Strong adaptability: Strategy parameters can be flexibly adjusted for different market conditions
- Clear operational logic: Explicit entry and exit conditions, easy to execute
- Comprehensive analysis: Considers both short-term fluctuations and long-term trends, improving trading stability
Strategy Risks
- Trend reversal risk: May lag in volatile markets
- Parameter sensitivity: Different parameter combinations may lead to drastically different results
- Market adaptability: May generate frequent trades in ranging markets
- Capital management: Requires reasonable position control to handle market volatility
- Technical dependence: Reliance on technical indicators may overlook fundamental factors
Strategy Optimization Directions
- Add volatility filter: Adjust trading thresholds during high volatility periods
- Incorporate multi-timeframe analysis: Combine signals from different timeframes to improve accuracy
- Optimize parameter adaptation: Dynamically adjust indicator parameters based on market conditions
- Improve profit/loss management: Add dynamic take-profit and stop-loss mechanisms
- Add volume confirmation: Incorporate volume analysis to enhance signal reliability
Summary
The strategy constructs a robust trading system by cleverly combining the WaveTrend indicator with trend filters. While maintaining operational simplicity, it achieves comprehensive market analysis. Although certain risks exist, the strategy has good practical value and development potential through proper risk management and continuous optimization.
- 1