Multi-Indicator Dynamic Trend Following Strategy Based on EMA and SMA

Strategy Overview
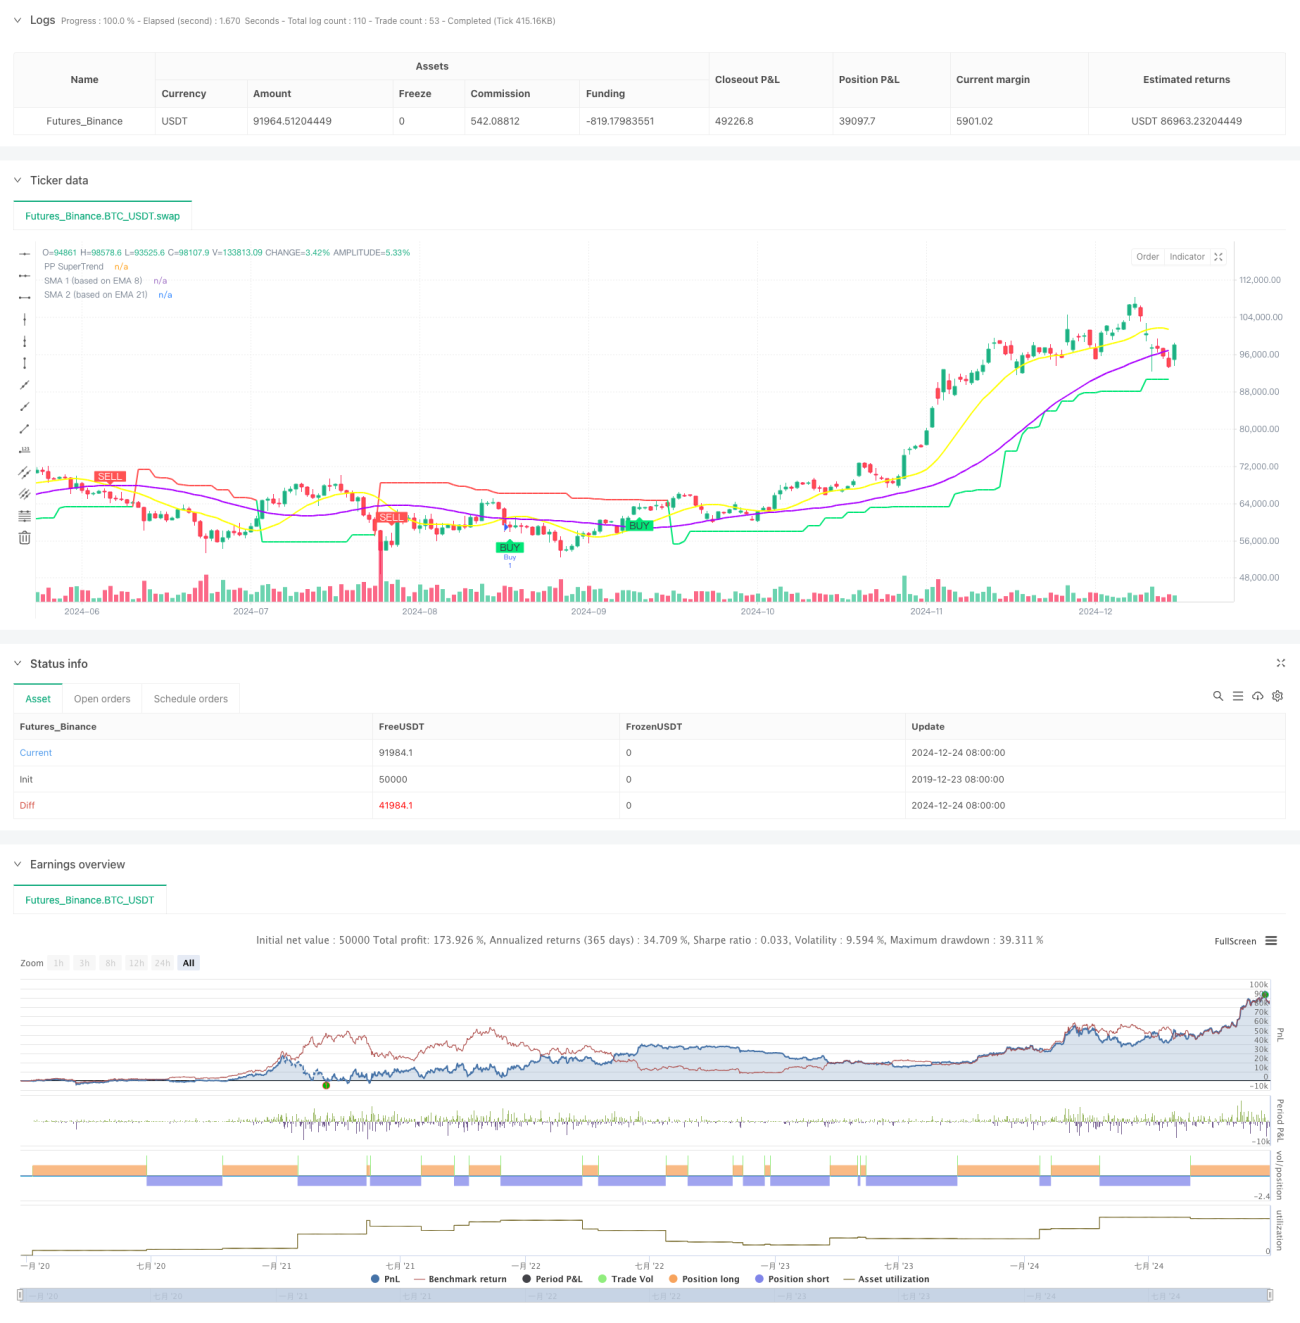
This strategy is a dynamic trend following system that combines multiple technical indicators. It integrates Pivot Points, SuperTrend indicator, and moving average crossover signals to identify market trends and trading opportunities. The strategy's key feature is its fixed timeframe analysis approach, ensuring signal consistency while validating signals through pivot points.
Strategy Principles
The strategy operates based on the following core mechanisms:
- Uses fixed timeframe price data for analysis, avoiding interference from different timeframes
- Calculates SMAs based on 8-period and 21-period EMAs to form trend following foundation
- Combines ATR and pivot points to calculate SuperTrend indicator for trend direction confirmation
- Only considers SMA crossover signals valid if they occur within 3 periods of a pivot point
- Dynamically calculates and tracks support/resistance levels for trading reference
Strategy Advantages
- Multiple indicator cross-validation improves signal reliability
- Fixed timeframe analysis reduces false signal interference
- Pivot point validation ensures trades occur at key price levels
- Dynamic tracking of support/resistance helps determine stop-loss and take-profit levels
- SuperTrend indicator provides additional trend direction confirmation
- Flexible parameter settings allow adjustment for different market conditions
Strategy Risks
- Multiple indicators may lead to signal lag
- May generate excessive false signals in ranging markets
- Fixed timeframe analysis might miss important signals in other timeframes
- Pivot point validation may cause missing some important trading opportunities
- Parameter optimization may lead to overfitting
Strategy Optimization Directions
- Introduce volatility filtering mechanism to reduce trading frequency during low volatility periods
- Add trend strength confirmation indicators like ADX or MACD
- Develop adaptive parameter system that dynamically adjusts based on market conditions
- Incorporate volume analysis to improve signal reliability
- Implement dynamic stop-loss mechanism that adjusts based on market volatility
Summary
This strategy establishes a relatively complete trend following trading system through the combination of multiple technical indicators. Its core advantage lies in improving signal reliability through fixed timeframe analysis and pivot point validation. While there are certain lag risks, these can be effectively controlled through parameter optimization and risk management measures. Traders are advised to conduct thorough backtesting before live implementation and adjust parameters according to specific market characteristics.
- 1