概述
该策略是一个结合了指数移动平均线(EMA)和相对强弱指标(RSI)的趋势反转交易系统。通过9周期和21周期EMA的交叉信号,配合RSI指标在50水平的突破确认,为交易者提供准确的趋势转折点。系统设计了完整的风险控制机制,包括固定止盈止损比率,能有效控制回撤。
策略原理
策略的核心逻辑基于快速EMA(9周期)与慢速EMA(21周期)的交叉,并使用RSI指标进行动量确认。当快速EMA向上穿越慢速EMA,同时RSI大于50时,系统发出做多信号;当快速EMA向下穿越慢速EMA,同时RSI小于50时,系统发出平仓信号。通过EMA交叉捕捉价格趋势变化,RSI则用于过滤假突破,提高信号质量。系统还集成了基于风险收益比的止盈止损机制,帮助交易者进行风险管理。
策略优势
- 双重确认机制:通过EMA交叉和RSI确认相结合,大大降低了假信号的概率
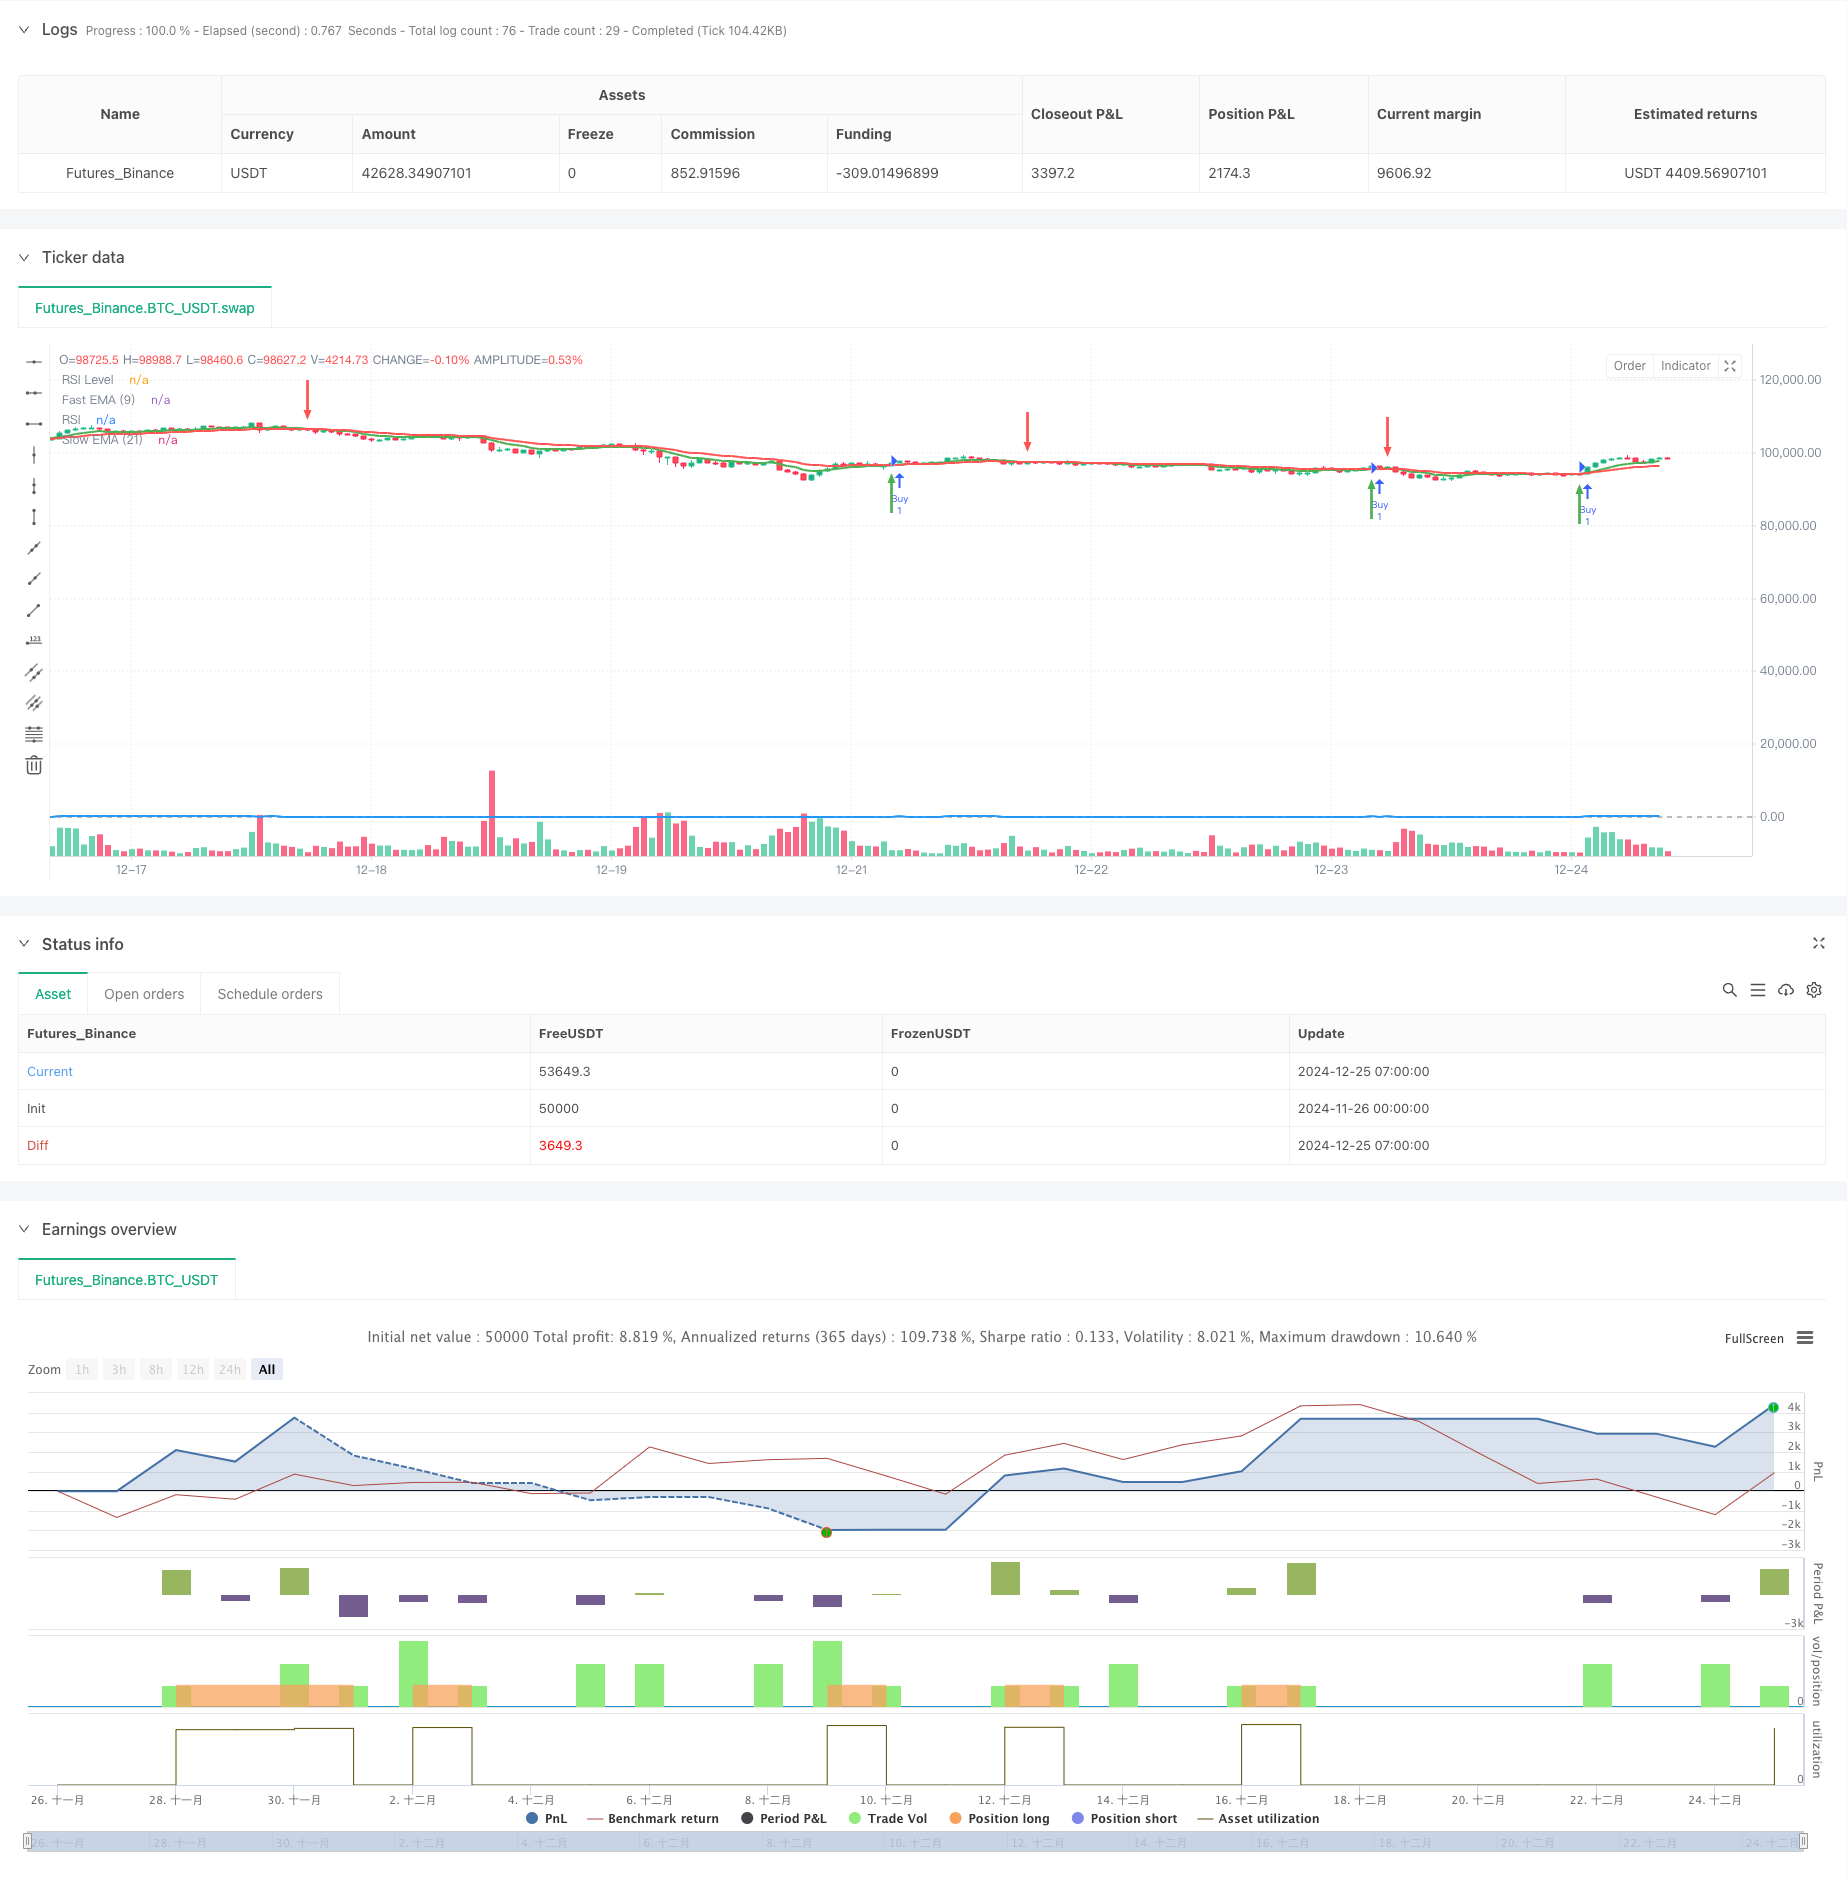
- 可视化清晰:利用绿色和红色箭头标注买卖点,交易信号直观明确
- 风险管理完善:内置止盈止损功能,可根据市场波动度灵活调整风险收益比
- 适应性强:核心参数均可调整,能适应不同市场环境和交易品种
- 执行简单:交易规则明确,适合自动化交易系统实现
策略风险
- 横盘市场效果欠佳:在区间震荡行情下可能产生频繁假信号
- 滞后性风险:移动平均线具有一定滞后性,可能错过最佳入场时机
- RSI误判:在极端行情下,RSI指标可能产生误导性信号
- 参数敏感性:不同市场环境可能需要调整参数,增加了策略维护成本 解决方案:建议在趋势明确的市场环境下使用,可通过增加ATR指标进行波动率过滤,并结合更长周期趋势判断。
策略优化方向
- 引入波动率过滤:建议添加ATR指标,在低波动率环境下停止交易
- 优化止盈止损:可考虑使用动态止损,如跟踪止损或基于ATR的止损设置
- 增加趋势强度过滤:可引入更长周期的趋势指标,只在主趋势方向交易
- 完善交易量确认:建议加入成交量分析,提高信号可靠性
- 市场环境分类:可根据不同市场环境动态调整参数,提高策略适应性
总结
该策略通过结合EMA交叉和RSI动量确认,构建了一个稳健的趋势跟踪系统。完善的风险控制机制和清晰的可视化界面使其具有很好的实用性。虽然在横盘市场表现略显不足,但通过建议的优化方向,策略的整体性能有望得到进一步提升。建议交易者在实盘使用前进行充分的回测,并根据具体交易品种特点调整参数。
策略源码
/*backtest
start: 2024-11-26 00:00:00
end: 2024-12-25 08:00:00
period: 1h
basePeriod: 1h
exchanges: [{"eid":"Futures_Binance","currency":"BTC_USDT"}]
*/

//@version=5
strategy("EMA Crossover with RSI Confirmation and Buy/Sell Signals", overlay=true)

// Input for EMAs and RSI
fastLength = input.int(9, title="Fast EMA Length")
slowLength = input.int(21, title="Slow EMA Length")
rsiLength = input.int(14, title="RSI Length")
rsiLevel = input.int(50, title="RSI Level", minval=0, maxval=100)

// Calculate the EMAs and RSI
fastEMA = ta.ema(close, fastLength)
slowEMA = ta.ema(close, slowLength)
rsi = ta.rsi(close, rsiLength)

// Plot the EMAs on the chart
plot(fastEMA, color=color.green, linewidth=2, title="Fast EMA (9)")
plot(slowEMA, color=color.red, linewidth=2, title="Slow EMA (21)")

// Plot the RSI on a separate pane (below the chart)
hline(rsiLevel, "RSI Level", color=color.gray)
plot(rsi, color=color.blue, linewidth=2, title="RSI")

// Buy condition: Fast EMA crosses above Slow EMA and RSI crosses above 50
buyCondition = ta.crossover(fastEMA, slowEMA) and rsi > rsiLevel

// Sell condition: Fast EMA crosses below Slow EMA and RSI crosses below 50
sellCondition = ta.crossunder(fastEMA, slowEMA) and rsi < rsiLevel

// Execute trades based on conditions
if (buyCondition)
    strategy.entry("Buy", strategy.long)
    label.new(bar_index, low, "Buy", color=color.green, textcolor=color.white, style=label.style_label_up, size=size.small)

if (sellCondition)
    strategy.close("Buy")
    label.new(bar_index, high, "Sell", color=color.red, textcolor=color.white, style=label.style_label_down, size=size.small)

// Strategy exit (optional): Fixed risk-to-reward ratio (take profit and stop loss)
takeProfit = input.int(2, title="Take Profit (Risk-Reward)", minval=1)
stopLoss = input.int(1, title="Stop Loss (Risk-Reward)", minval=1)

strategy.exit("Exit Buy", "Buy", stop=close * (1 - stopLoss / 100), limit=close * (1 + takeProfit / 100))

// Plot buy/sell arrows for visualization
plotarrow(buyCondition ? 1 : na, offset=-1, colorup=color.green, maxheight=30, title="Buy Signal Arrow")
plotarrow(sellCondition ? -1 : na, offset=-1, colordown=color.red, maxheight=30, title="Sell Signal Arrow")
相关推荐