概述
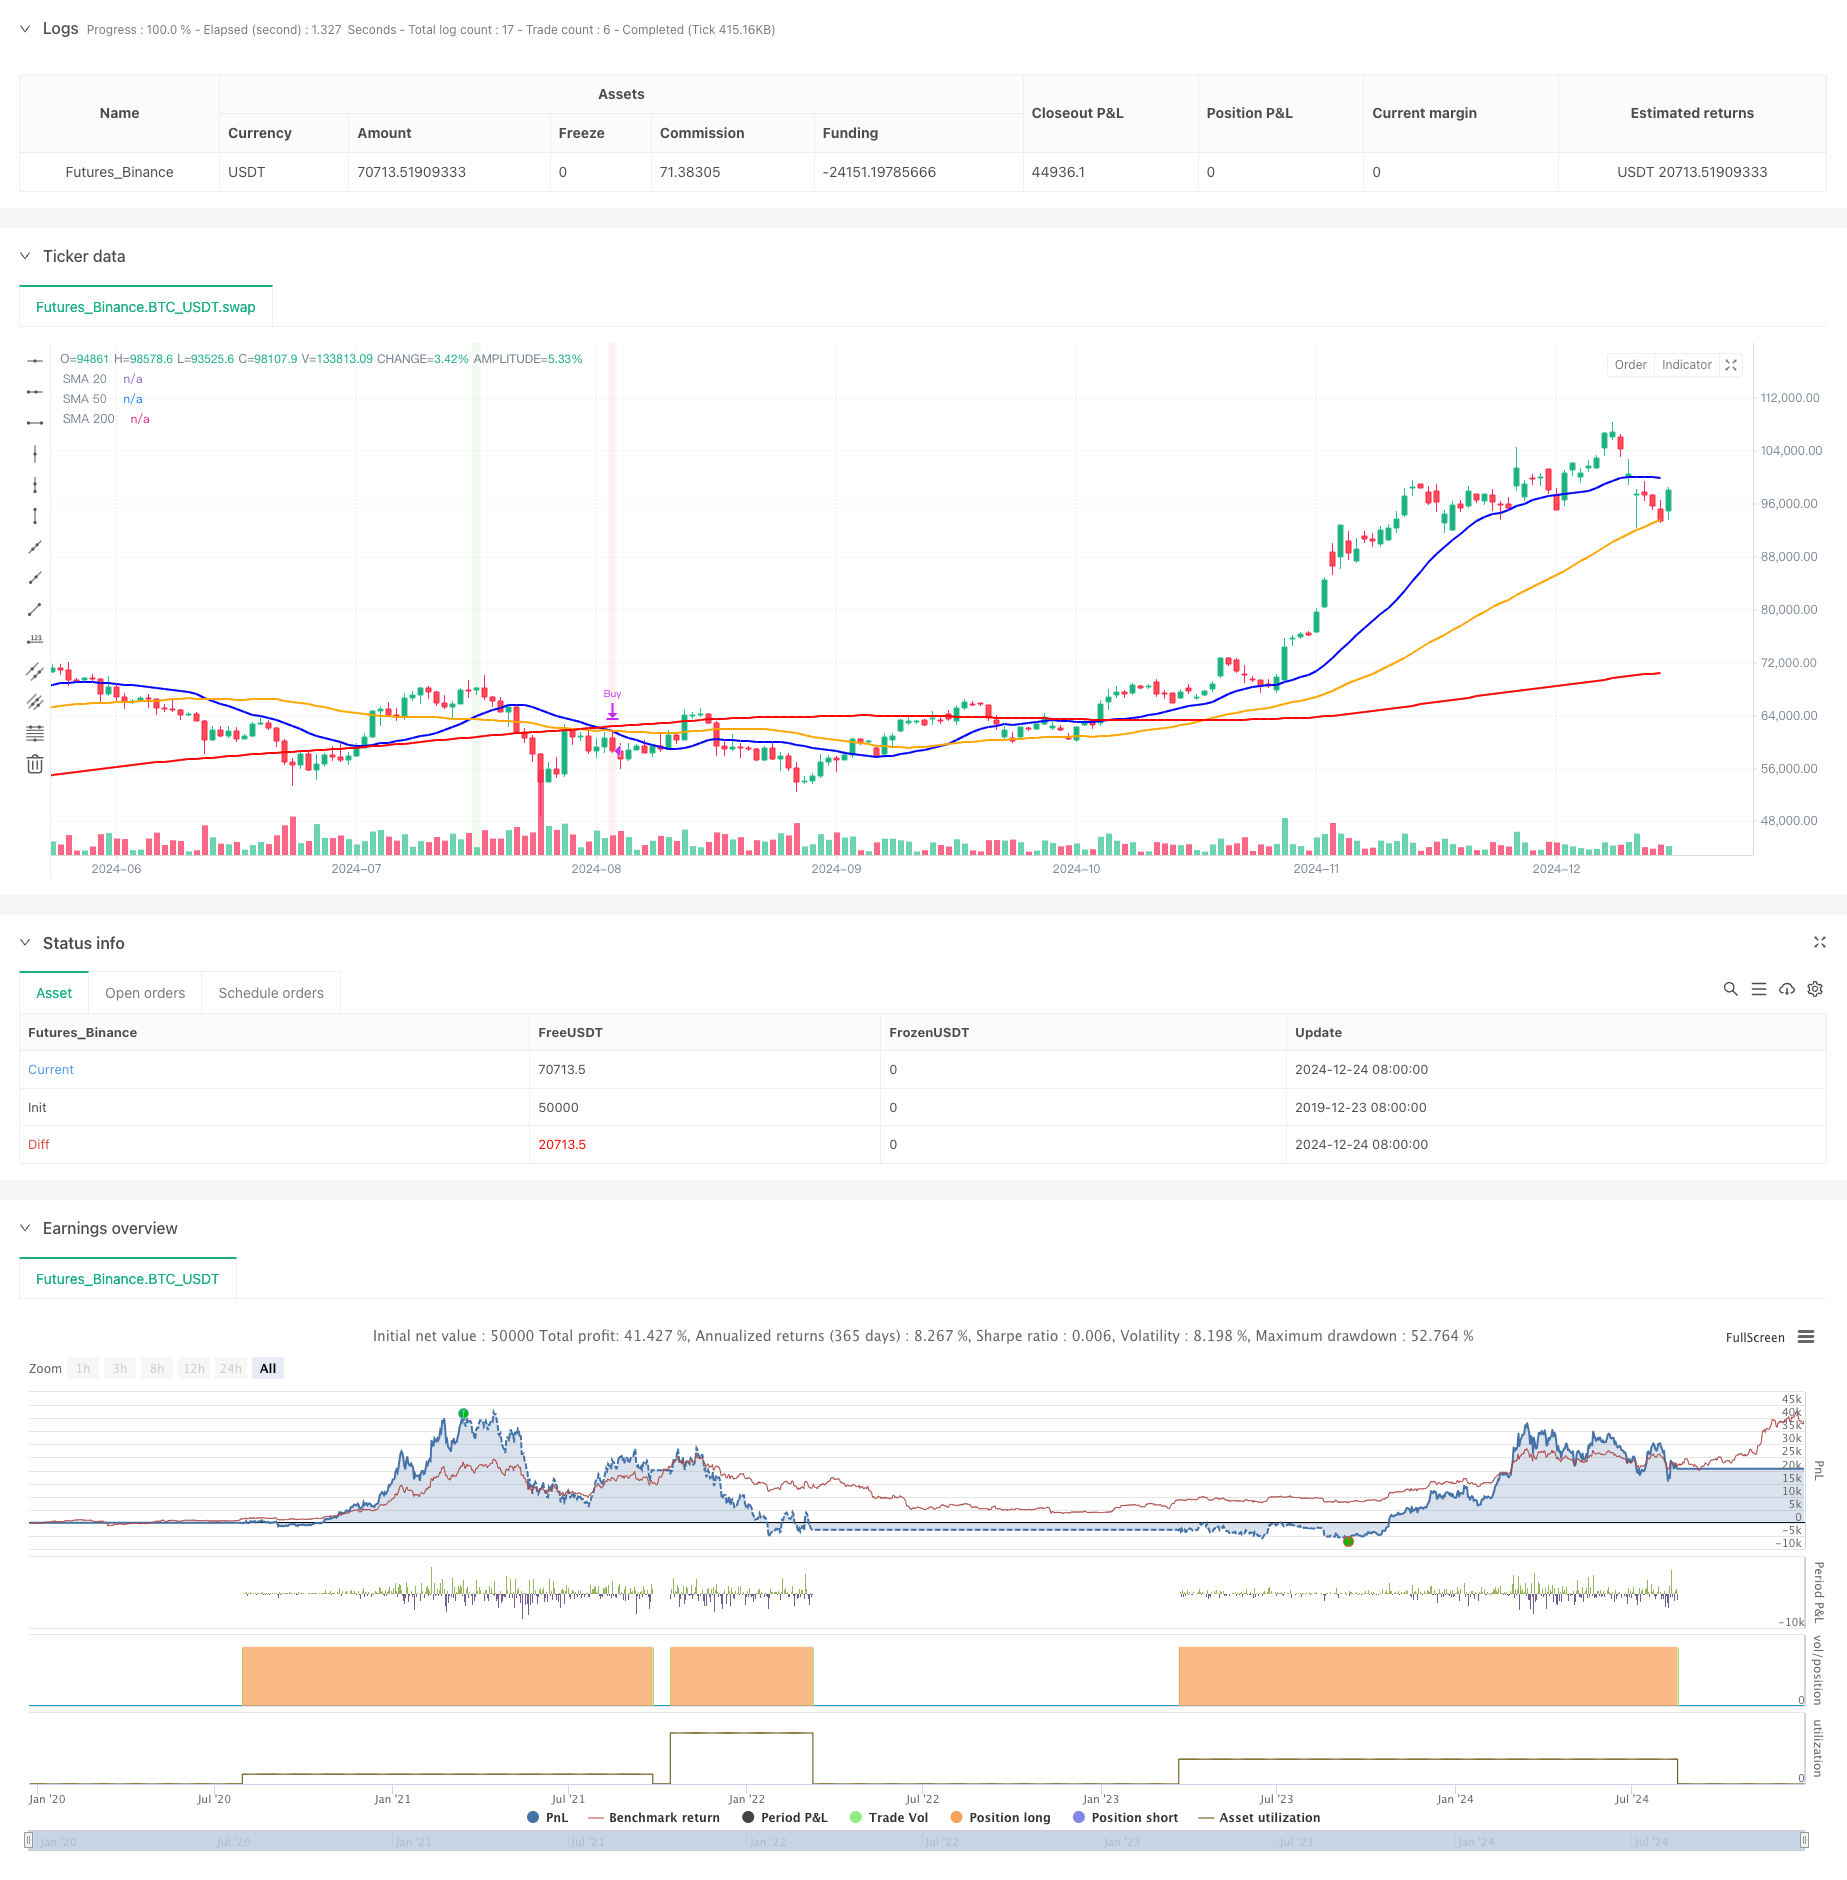
本策略是一个基于多重移动平均线(SMA)交叉信号的量化交易系统。它综合运用了20日、50日和200日三条不同周期的简单移动平均线,通过捕捉均线交叉信号和价格位置关系来识别市场趋势变化和潜在的交易机会。该策略不仅考虑了短期和中期均线的交叉信号,还将长期均线作为趋势过滤器,有效提升了交易质量。
策略原理
策略的核心逻辑基于以下几个关键要素: 1. 使用20日均线作为短期趋势指标,50日均线作为中期趋势指标,200日均线作为长期趋势指标 2. 主要入场信号:当20日均线向上穿越50日均线,且价格位于200日均线之上时,系统产生做多信号 3. 主要出场信号:当20日均线向下穿越50日均线,且价格位于200日均线之下时,系统产生平仓信号 4. 次要信号:监测50日均线与200日均线的交叉,作为辅助判断依据 5. 通过可视化标记和背景色变化,直观显示交易信号
策略优势
- 多重时间框架分析:通过整合不同周期的移动平均线,全面把握市场走势
- 趋势过滤:利用200日均线作为趋势过滤器,有效降低假突破风险
- 信号分层:区分主次信号,提供更全面的市场洞察
- 可视化增强:使用标记和背景色,提升策略可读性
- 参数灵活:允许自定义均线周期、颜色和线宽,适应不同交易需求
策略风险
- 震荡市场风险:在横盘整理阶段可能产生频繁的虚假信号
- 滞后性风险:移动平均线本质上是滞后指标,可能错过关键转折点
- 参数依赖:不同市场环境下最优参数可能存在显著差异
- 趋势依赖:策略在明显趋势市场表现较好,但在区间震荡时效果欠佳
- 信号冲突:多重均线可能产生相互矛盾的信号
策略优化方向
- 引入波动率指标:考虑加入ATR等波动率指标,动态调整仓位规模
- 增加成交量确认:结合成交量分析,提高信号可靠性
- 优化出场机制:设计更灵活的止损止盈策略
- 加入市场环境过滤:开发市场环境识别模块,在不同市场状态下采用不同参数
- 实现自适应参数:根据市场特征动态调整均线周期
总结
这是一个结构完整、逻辑清晰的多重均线交易策略。通过综合运用不同周期的移动平均线,并结合价格位置关系,策略能够较好地捕捉市场趋势变化。虽然存在一定的滞后性和震荡市场风险,但通过合理的参数设置和信号过滤,策略仍具有较好的实用价值。未来可以通过引入更多技术指标和优化信号生成机制来进一步提升策略的稳定性和可靠性。
策略源码
/*backtest
start: 2019-12-23 08:00:00
end: 2024-12-25 08:00:00
period: 1d
basePeriod: 1d
exchanges: [{"eid":"Futures_Binance","currency":"BTC_USDT"}]
*/

//@version=5
strategy("SMA 20/50/200 Strateji", overlay=true)

// SMA Periyotlarını, renklerini ve çizgi kalınlıklarını özelleştirme
sma20_period = input.int(20, title="SMA 20 Periyodu", minval=1)
sma50_period = input.int(50, title="SMA 50 Periyodu", minval=1)
sma200_period = input.int(200, title="SMA 200 Periyodu", minval=1)

sma20_color = input.color(color.blue, title="SMA 20 Rengi")
sma50_color = input.color(color.orange, title="SMA 50 Rengi")
sma200_color = input.color(color.red, title="SMA 200 Rengi")

sma20_width = input.int(2, title="SMA 20 Kalınlığı", minval=1, maxval=5)
sma50_width = input.int(2, title="SMA 50 Kalınlığı", minval=1, maxval=5)
sma200_width = input.int(2, title="SMA 200 Kalınlığı", minval=1, maxval=5)

// SMA Hesaplamaları
sma20 = ta.sma(close, sma20_period)
sma50 = ta.sma(close, sma50_period)
sma200 = ta.sma(close, sma200_period)

// Al ve Sat Koşulları
buyCondition = ta.crossover(sma20, sma50) and close > sma200
sellCondition = ta.crossunder(sma20, sma50) and close < sma200

buyCondition_50_200 = ta.crossover(sma50, sma200)
sellCondition_50_200 = ta.crossunder(sma50, sma200)

// Grafik üzerine SMA çizimleri
plot(sma20, color=sma20_color, linewidth=sma20_width, title="SMA 20")
plot(sma50, color=sma50_color, linewidth=sma50_width, title="SMA 50")
plot(sma200, color=sma200_color, linewidth=sma200_width, title="SMA 200")

// Al-Sat Stratejisi
if buyCondition
    strategy.entry("Buy", strategy.long)
    label.new(bar_index, low, "BUY", style=label.style_label_up, color=color.new(color.green, 0), textcolor=color.white)

if sellCondition
    strategy.close("Buy")
    label.new(bar_index, high, "SELL", style=label.style_label_down, color=color.new(color.red, 0), textcolor=color.white)

if buyCondition_50_200
    label.new(bar_index, low, "50/200 BUY", style=label.style_label_up, color=color.new(color.blue, 0), textcolor=color.white)

if sellCondition_50_200
    label.new(bar_index, high, "50/200 SELL", style=label.style_label_down, color=color.new(color.orange, 0), textcolor=color.white)

// Performans Görselleştirmesi İçin Arka Plan Rengi
bgColor = buyCondition ? color.new(color.green, 90) : sellCondition ? color.new(color.red, 90) : na
bgcolor(bgColor)
相关推荐