
Overview
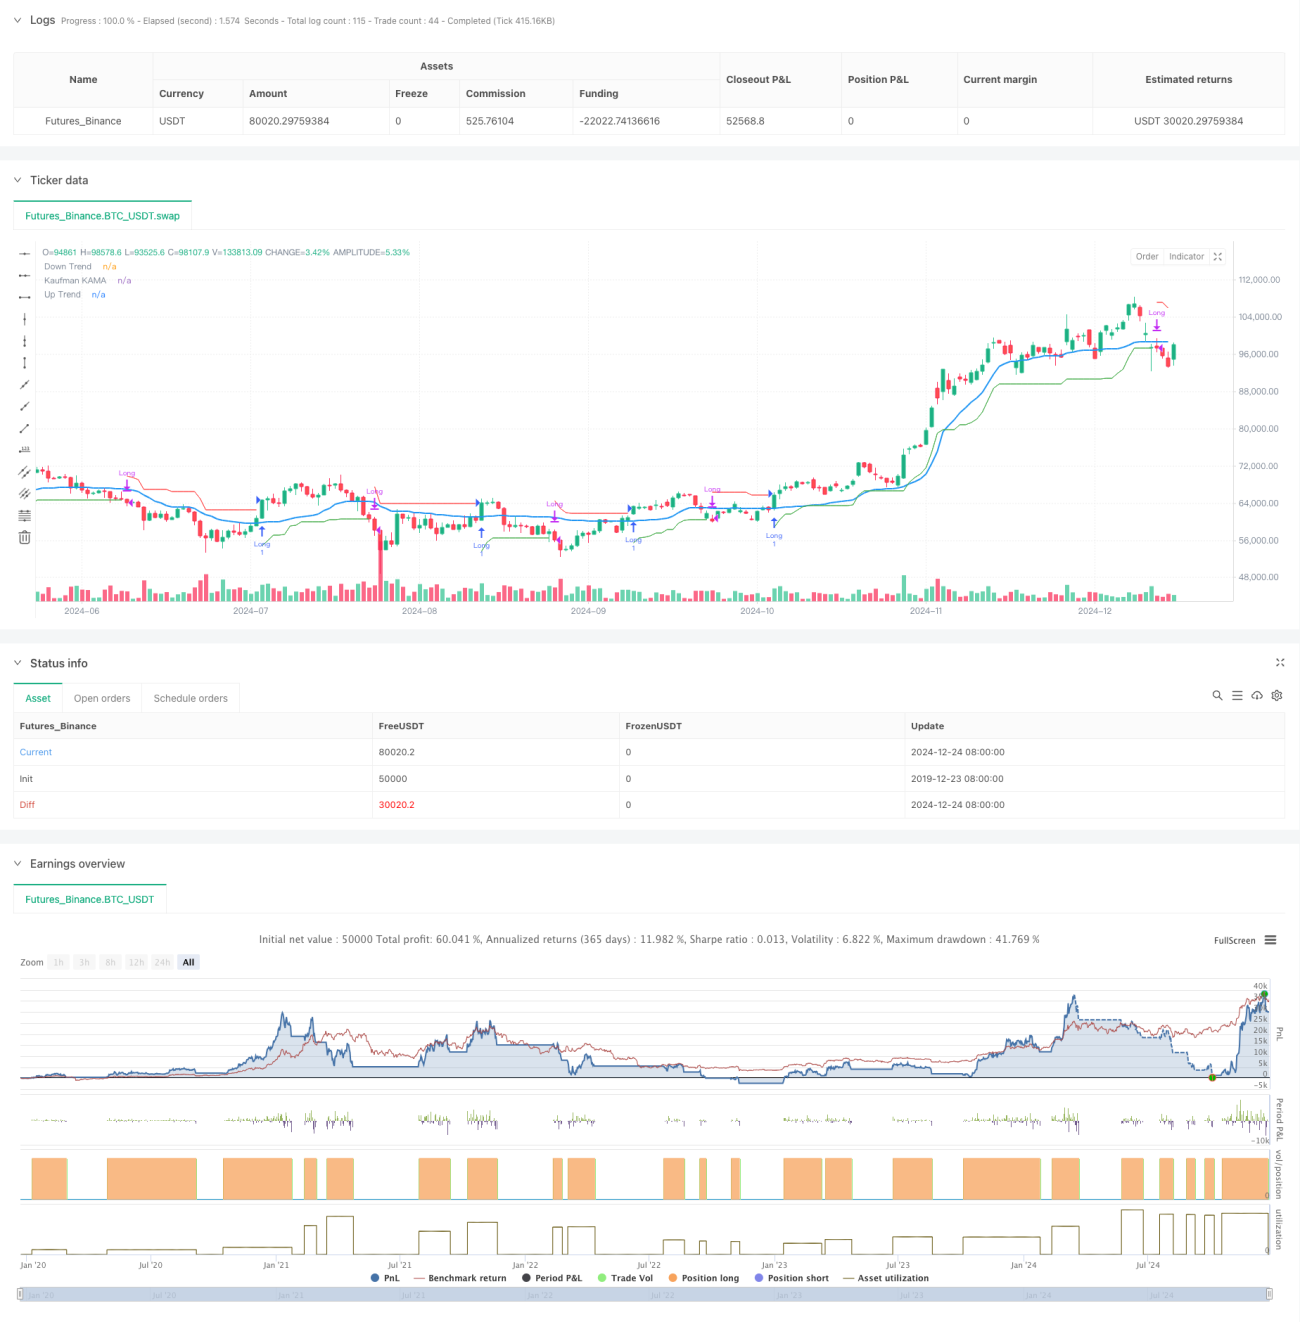
This strategy is a trend-following trading system that combines the Supertrend indicator with the Kaufman Adaptive Moving Average (KAMA). It dynamically identifies market trend changes, seeks long opportunities in uptrends, and employs flexible stop-loss mechanisms for risk control. The core concept relies on the Supertrend indicator's trend direction determination capability, combined with KAMA's market volatility adaptive characteristics, to establish long positions in upward market trends.
Strategy Principles
The strategy employs a dual technical indicator confirmation system. First, the Supertrend indicator calculates trend direction using ATR and custom coefficients, indicating an uptrend when the indicator line is below the price. Second, the KAMA indicator adjusts moving average sensitivity through an adaptive mechanism, better accommodating different market conditions. Entry signals require two simultaneous conditions: Supertrend indicating an uptrend and price above the KAMA line. Similarly, exit signals need dual confirmation: Supertrend switching to downtrend and price falling below the KAMA line. This dual confirmation mechanism effectively reduces false signals.
Strategy Advantages
- Implements dual technical indicator confirmation, improving signal reliability
- KAMA indicator features adaptive characteristics, adjusting sensitivity to market volatility
- Supertrend indicator provides clear trend direction signals
- Comprehensive stop-loss mechanism for effective risk control
- Clear strategy logic with adjustable parameters
- Definitive entry and exit signals, easy to execute
Strategy Risks
- May generate frequent trading signals in choppy markets, increasing transaction costs
- Potential lag during initial trend reversals, affecting stop-loss effectiveness
- Improper parameter selection may lead to oversensitivity or sluggishness
- Significant slippage possible during rapid market fluctuations
- Trading costs and slippage may impact overall strategy returns
Strategy Optimization Directions
- Introduce volatility filtering mechanism to adjust parameters or pause trading during high volatility
- Add volume indicators for additional confirmation
- Optimize stop-loss mechanism, consider implementing trailing stops
- Enhance market environment assessment for strategy applicability
- Implement time filtering to avoid trading during specific periods
- Develop adaptive parameter optimization system
Conclusion
This strategy constructs a robust trend-following trading system by combining Supertrend and KAMA technical indicators. Its main advantages lie in adaptability and risk control capabilities, with enhanced trading signal reliability through dual confirmation. While facing challenges in choppy markets, the strategy's overall performance can be further improved through appropriate parameter settings and optimization implementations. It is particularly suitable for medium to long-term trend trading and performs well in markets with clear trends.
/*backtest
start: 2019-12-23 08:00:00
end: 2024-12-25 08:00:00
period: 1d
basePeriod: 1d
exchanges: [{"eid":"Futures_Binance","currency":"BTC_USDT"}]
*/

//@version=6
strategy("Supertrend + KAMA Long Strategy", overlay=true, commission_type=strategy.commission.percent, commission_value=0.1, slippage=3)

// User-defined inputs for date range- 1