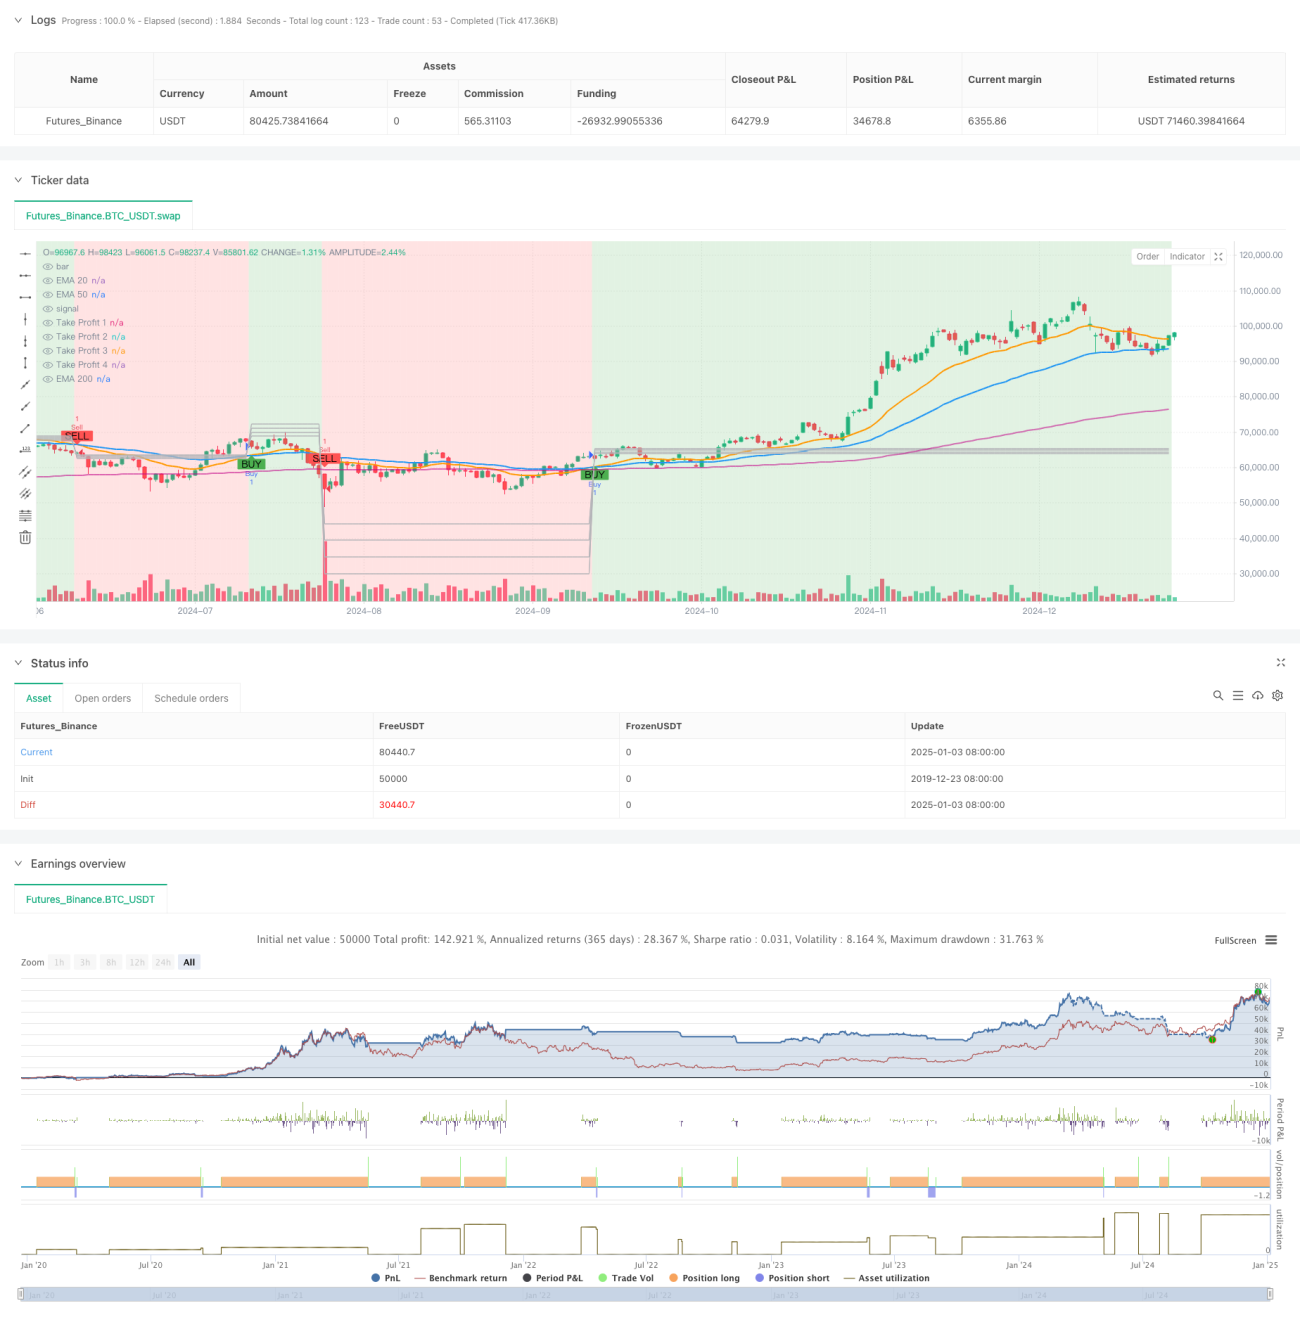
多层级多周期指数均线交叉动态盈利优化策略

EMA TP SL RSI MACD CCI ATR ROC MFI OBV
创建日期: 2025-01-06 10:50:38 最后修改: 2025-01-06 10:50:38
复制: 0 点击次数: 155
avatar of ChaoZhang ChaoZhang
1
关注
1264
关注者

多层级多周期指数均线交叉动态盈利优化策略

概述

该策略是一个基于指数移动平均线(EMA)的交易系统,主要利用EMA20和EMA50的交叉来识别市场趋势的变化。策略设计了动态的多层次获利点,并结合了止损机制来控制风险。系统通过背景颜色的变化直观地展示了市场趋势的方向,帮助交易者更好地把握市场走势。

策略原理

策略的核心逻辑基于以下几个方面: 1. 使用EMA20和EMA50的交叉来确定趋势方向:当EMA20上穿EMA50时产生买入信号,下穿时产生卖出信号 2. 基于前一根K线的波动范围动态设置四个获利目标: - TP1设置为0.5倍波动范围 - TP2设置为1.0倍波动范围 - TP3设置为1.5倍波动范围 - TP4设置为2.0倍波动范围 3. 设置3%的止损点来控制风险 4. 通过K线背景颜色的变化来展示趋势方向:上升趋势显示绿色,下降趋势显示红色

策略优势

  1. 动态获利点设置:根据市场实时波动度自动调整获利目标,适应性强
  2. 多层次获利机制:通过设置多个获利点,既保证了收益的锁定,又给予趋势充分发展的空间
  3. 可视化效果突出:趋势方向通过背景颜色直观显示,便于快速判断市场状态
  4. 风险控制完善:设置了固定止损点,有效控制每次交易的最大损失
  5. 参数灵活可调:交易者可根据不同市场条件调整获利点乘数和止损百分比

策略风险

  1. 均线滞后性:EMA本身具有滞后性,可能导致信号产生时机偏后
  2. 震荡市场风险:在横盘震荡市场中可能产生频繁的假信号
  3. 止损设置固定:固定百分比的止损可能不适合所有市场环境
  4. 获利点间隔:在剧烈波动的市场中,获利点的间距可能过大或过小

策略优化方向

  1. 引入辅助指标:可以添加RSI或MACD等指标作为交叉信号的确认
  2. 优化止损机制:可以考虑使用ATR来动态设置止损距离
  3. 增加时间过滤:添加交易时间窗口,避开波动剧烈的时段
  4. 完善仓位管理:根据市场波动度动态调整持仓规模
  5. 优化信号确认:可以增加成交量等指标作为辅助确认条件

总结

这是一个结构完整、逻辑清晰的趋势跟踪策略。通过均线交叉捕捉趋势,利用动态获利点管理收益,配合止损控制风险。策略的可视化设计直观有效,参数设置灵活可调。虽然存在均线固有的滞后性问题,但通过优化和完善可以进一步提升策略的稳定性和盈利能力。

策略源码
/*backtest
start: 2019-12-23 08:00:00
end: 2025-01-04 08:00:00
period: 1d
basePeriod: 1d
exchanges: [{"eid":"Futures_Binance","currency":"BTC_USDT"}]
*/

//@version=5
strategy("EMA Crossover Strategy with Take Profit and Candle Highlighting", overlay=true)

// Define the EMAs
ema200 = ta.ema(close, 200)
ema50 = ta.ema(close, 50)
ema20 = ta.ema(close, 20)

// Plot the EMAs
plot(ema200, color=#c204898e, title="EMA 200", linewidth=2)
plot(ema50, color=color.blue, title="EMA 50", linewidth=2)
plot(ema20, color=color.orange, title="EMA 20", linewidth=2)

// Define Buy and Sell conditions based on EMA crossover
buySignal = ta.crossover(ema20, ema50)  // EMA 20 crosses above EMA 50 (Bullish)
sellSignal = ta.crossunder(ema20, ema50) // EMA 20 crosses below EMA 50 (Bearish)

// Define input values for Take Profit multipliers
tp1_multiplier = input.float(0.5, title="TP1 Multiplier", minval=0.1, maxval=5.0, step=0.1)
tp2_multiplier = input.float(1.0, title="TP2 Multiplier", minval=0.1, maxval=5.0, step=0.1)
tp3_multiplier = input.float(1.5, title="TP3 Multiplier", minval=0.1, maxval=5.0, step=0.1)
tp4_multiplier = input.float(2.0, title="TP4 Multiplier", minval=0.1, maxval=5.0, step=0.1)

// Define Take Profit Levels as float variables initialized with na
var float takeProfit1 = na
var float takeProfit2 = na
var float takeProfit3 = na
var float takeProfit4 = na

// Calculate take profit levels based on the multipliers
if buySignal
    takeProfit1 := high + (high - low) * tp1_multiplier  // TP1: Set TP at multiplier of previous range above the high
    takeProfit2 := high + (high - low) * tp2_multiplier  // TP2: Set TP at multiplier of previous range above the high
    takeProfit3 := high + (high - low) * tp3_multiplier  // TP3: Set TP at multiplier of previous range above the high
    takeProfit4 := high + (high - low) * tp4_multiplier  // TP4: Set TP at multiplier of previous range above the high

if sellSignal
    takeProfit1 := low - (high - low) * tp1_multiplier  // TP1: Set TP at multiplier of previous range below the low
    takeProfit2 := low - (high - low) * tp2_multiplier  // TP2: Set TP at multiplier of previous range below the low
    takeProfit3 := low - (high - low) * tp3_multiplier  // TP3: Set TP at multiplier of previous range below the low
    takeProfit4 := low - (high - low) * tp4_multiplier  // TP4: Set TP at multiplier of previous range below the low

// Plot Take Profit Levels on the chart
plot(takeProfit1, color=#b4b4b8, style=plot.style_line, linewidth=1, title="Take Profit 1")
plot(takeProfit2, color=#b4b4b8, style=plot.style_line, linewidth=1, title="Take Profit 2")
plot(takeProfit3, color=#b4b4b8, style=plot.style_line, linewidth=1, title="Take Profit 3")
plot(takeProfit4, color=#b4b4b8, style=plot.style_line, linewidth=1, title="Take Profit 4")

// Create buy and sell signals on the chart
plotshape(series=buySignal, location=location.belowbar, color=color.green, style=shape.labelup, title="Buy Signal", text="BUY")
plotshape(series=sellSignal, location=location.abovebar, color=color.red, style=shape.labeldown, title="Sell Signal", text="SELL")

// Highlight the candles based on trend direction
uptrend = ta.crossover(ema20, ema50)  // EMA 20 crosses above EMA 50 (Bullish)
downtrend = ta.crossunder(ema20, ema50)  // EMA 20 crosses below EMA 50 (Bearish)

// Highlighting candles based on trend
bgcolor(color = ema20 > ema50 ? color.new(color.green, 80) : ema20 < ema50 ? color.new(color.red, 80) : na)

// Execute buy and sell orders on the chart
strategy.entry("Buy", strategy.long, when=buySignal)
strategy.entry("Sell", strategy.short, when=sellSignal)

// Exit conditions based on Take Profit levels
strategy.exit("Take Profit 1", "Buy", limit=takeProfit1)
strategy.exit("Take Profit 2", "Buy", limit=takeProfit2)
strategy.exit("Take Profit 3", "Buy", limit=takeProfit3)
strategy.exit("Take Profit 4", "Buy", limit=takeProfit4)

strategy.exit("Take Profit 1", "Sell", limit=takeProfit1)
strategy.exit("Take Profit 2", "Sell", limit=takeProfit2)
strategy.exit("Take Profit 3", "Sell", limit=takeProfit3)
strategy.exit("Take Profit 4", "Sell", limit=takeProfit4)

// Optionally, add a stop loss
stopLoss = 0.03  // Example: 3% stop loss
strategy.exit("Stop Loss", "Buy", stop=close * (1 - stopLoss))
strategy.exit("Stop Loss", "Sell", stop=close * (1 + stopLoss))
相关推荐