
Overview
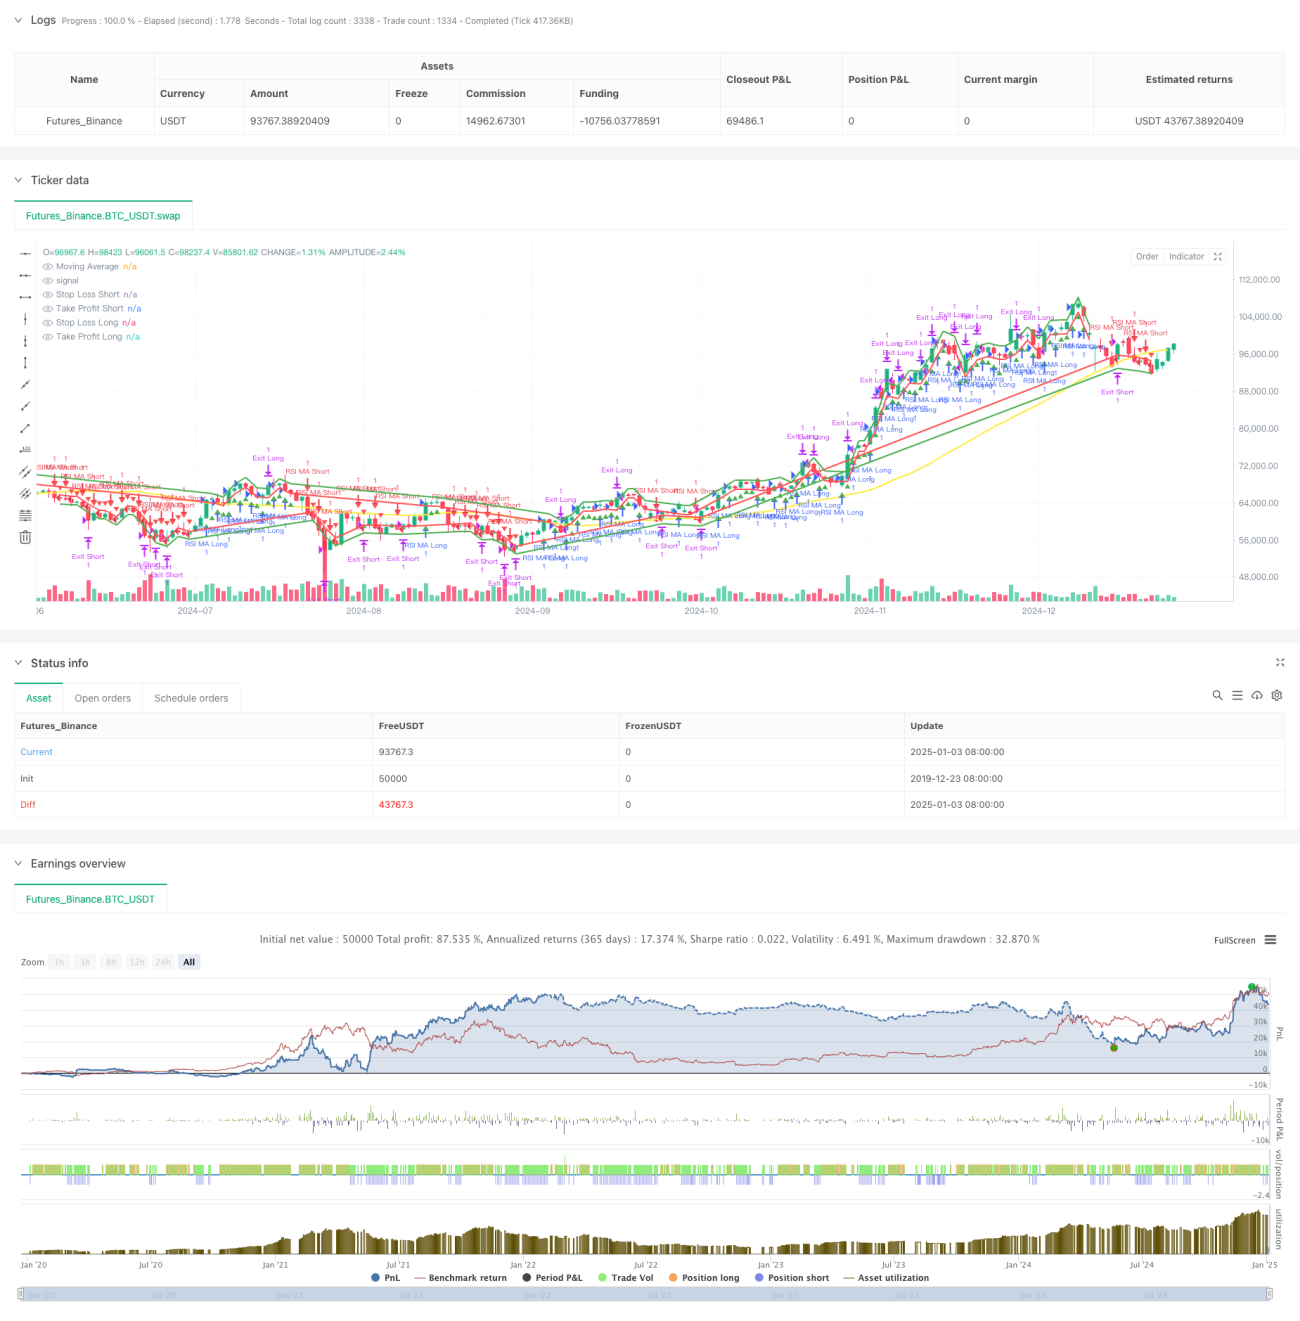
This strategy is a trend following trading system that combines the Relative Strength Index (RSI) and Simple Moving Average (SMA). It identifies market trend direction using moving averages while confirming momentum with RSI, executing trades when trend and momentum align. The strategy includes comprehensive stop-loss and take-profit mechanisms for effective risk control.
Strategy Principle
The core logic is based on the combination of two technical indicators:
- Moving Average (MA): Used to determine overall trend. A bullish trend is identified when price is above MA, bearish when below.
- Relative Strength Index (RSI): Used to confirm price momentum. Upward momentum is confirmed when RSI exceeds a threshold (e.g., 55), downward momentum when below threshold (e.g., 45).
Trading signal generation logic:
- Long conditions: Price above MA and RSI above buy threshold
- Short conditions: Price below MA and RSI below sell threshold
Risk control employs percentage-based stop-loss and take-profit levels, set as fixed percentages of entry price.
Strategy Advantages
- Signal stability: Reduces false signals through dual confirmation of trend and momentum
- Comprehensive risk management: Fixed percentage stop-loss and take-profit effectively control risk per trade
- Parameter flexibility: Key parameters like MA period and RSI thresholds can be optimized for different market characteristics
- Clear strategy logic: Trading rules are simple and intuitive to understand and execute
- High adaptability: Applicable to various trading timeframes
Strategy Risks
- Trend reversal risk: Consecutive stops may occur at trend turning points
- Range-bound market risk: Frequent trading losses possible in sideways markets
- Parameter dependency: Optimal parameters may vary significantly across market environments
- Slippage risk: Significant slippage possible during high volatility
- Technical indicator lag: MA and RSI have inherent lag, potentially delaying entry timing
Strategy Optimization Directions
- Dynamic parameter optimization: Introduce adaptive parameter mechanisms adjusting MA period and RSI thresholds based on market volatility
- Market environment filtering: Add volatility filtering mechanism to adjust position sizing or pause trading in high volatility
- Multiple timeframe analysis: Incorporate longer timeframe trend confirmation to improve directional accuracy
- Stop-loss optimization: Implement trailing stops for better profit protection
- Signal filtering: Add volume and other auxiliary indicators to improve signal reliability
Summary
This strategy constructs a logically clear and risk-controlled trading system by combining trend and momentum indicators. While inherent risks exist, the strategy demonstrates good practicality through appropriate parameter settings and risk control. Future optimization focuses on dynamic parameter adjustment, market environment recognition, and signal quality improvement, potentially enhancing strategy stability and profitability.
- 1