Dual-Period Moving Average with RSI Momentum and Volume Trend Following Strategy

Overview
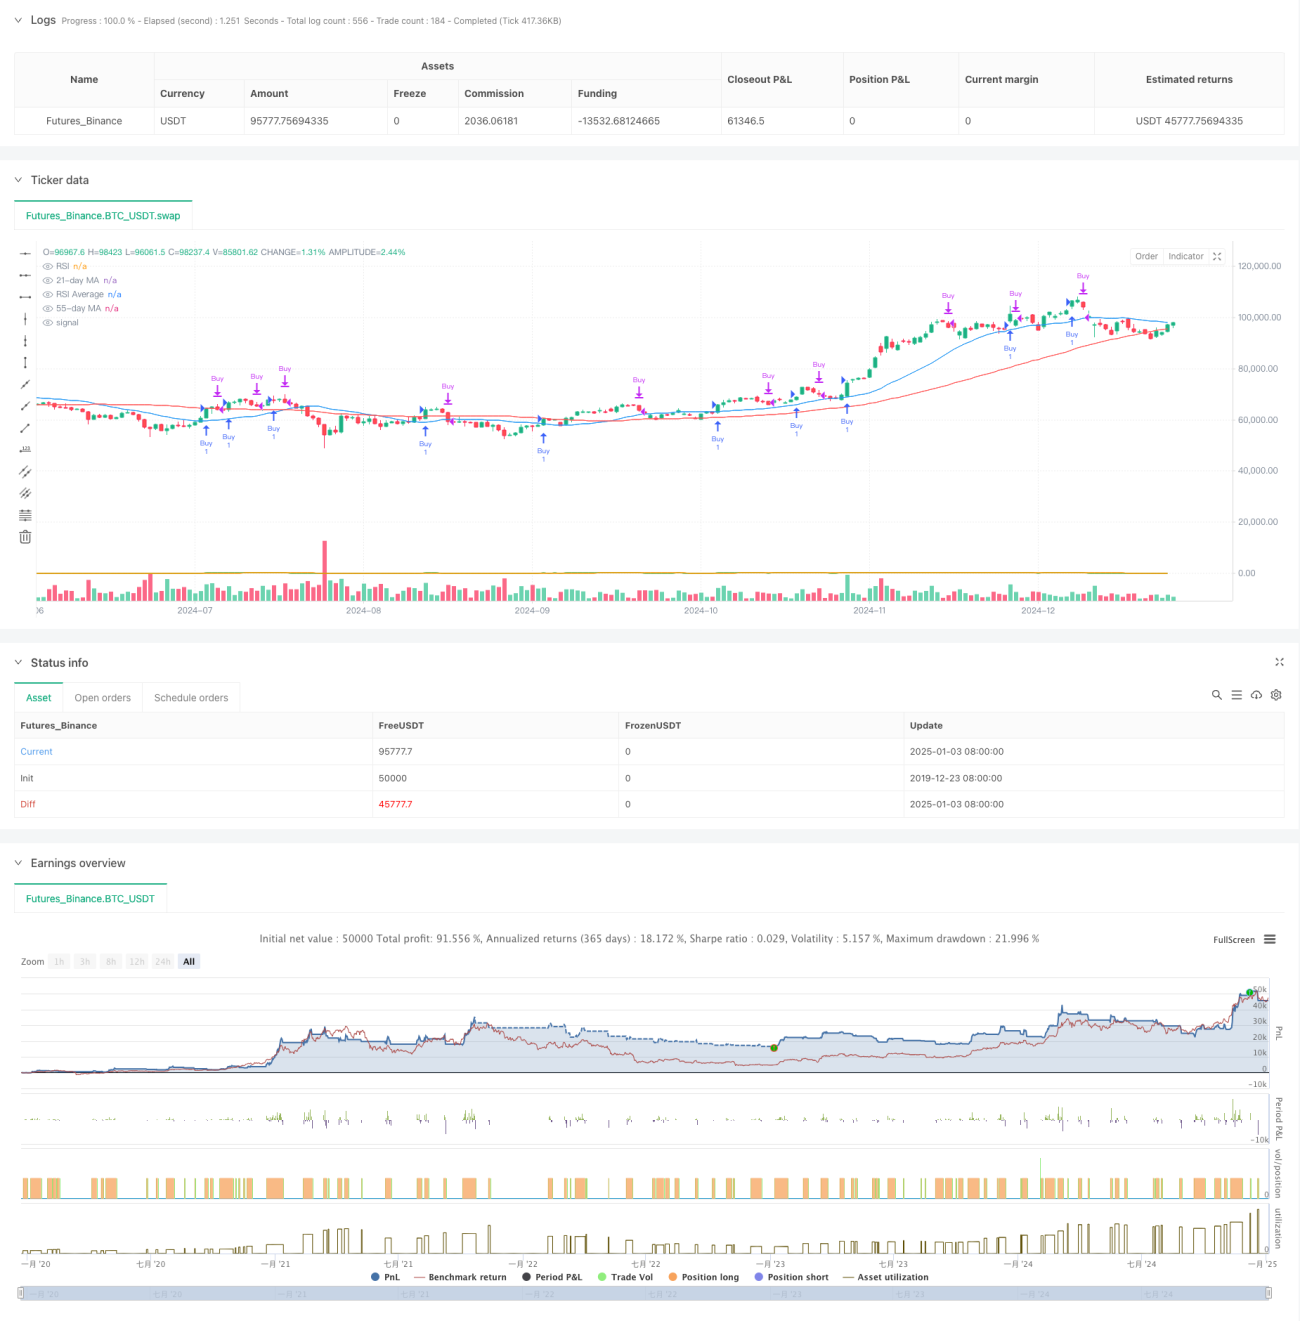
This is a trend-following strategy that combines dual-period moving averages (21-day and 55-day), RSI momentum indicator, and volume analysis. The strategy analyzes market information from three dimensions - price, momentum, and volume - while confirming trend direction and filtering trading signals through RSI and volume indicators to improve trading accuracy. The strategy requires price breakthrough of short-term moving average, RSI crossing above its average, and increased volume to confirm trend validity.
Strategy Principles
The strategy employs a triple-filtering mechanism:
- Price Filter: Uses 21-day and 55-day moving averages to confirm price trends, with prices above 21-day MA indicating potential long opportunities
- Momentum Filter: Calculates 13-period RSI and its 13-period average, confirming momentum direction when RSI crosses above its average
- Volume Filter: Calculates 21-period volume moving average, requiring entry volume to exceed its average, confirming market participation
Buy conditions require all of the following:
- Close price above 21-day MA
- RSI above its average
- Volume above volume MA
Sell conditions require any of the following:
- Price falls below 55-day MA
- RSI falls below its average
Strategy Advantages
- Multi-dimensional Analysis: Improves signal reliability through comprehensive analysis of price, momentum, and volume
- Trend Confirmation: Dual-period moving averages better confirm trend direction and strength
- Dynamic Adaptation: RSI indicator dynamically adapts to market volatility, helping capture momentum changes
- Volume-Price Coordination: Uses volume as a filter condition, ensuring trades occur during periods of high market activity
- Risk Control: Sets clear stop-loss conditions, helping control risk
Strategy Risks
- Lag Risk: Moving averages are inherently lagging indicators, potentially causing delayed entry and exit
- Range-bound Market Risk: May generate frequent false breakout signals in sideways markets
- Parameter Sensitivity: Strategy effectiveness is sensitive to parameter settings, requiring adjustment in different market environments
- Cost Risk: Frequent trading may incur high transaction costs
- Liquidity Risk: May be difficult to execute trades at ideal prices in low-liquidity markets
Strategy Optimization Directions
- Parameter Adaptation: Introduce adaptive mechanisms to dynamically adjust moving average periods based on market volatility
- Signal Confirmation: Add trend strength indicators (like ADX) to further filter trading signals
- Profit-Taking Optimization: Design dynamic profit-taking mechanisms to capture more gains in strong trends
- Position Management: Dynamically adjust position sizes based on signal strength and market volatility
- Time Filtering: Add trading time windows to avoid unfavorable trading periods
Summary
This is a trend-following strategy that comprehensively utilizes the three essential elements of technical analysis (price, volume, momentum). Through multiple filtering mechanisms, the strategy ensures signal reliability while maintaining risk control capabilities. Although it has some inherent limitations, through continuous optimization and improvement, the strategy has the potential to achieve stable returns in actual trading. The strategy may perform particularly well in markets with clear trends and sufficient liquidity.
- 1