Dual Technical Indicator Momentum Reversal Trading Strategy with Risk Management System

Overview
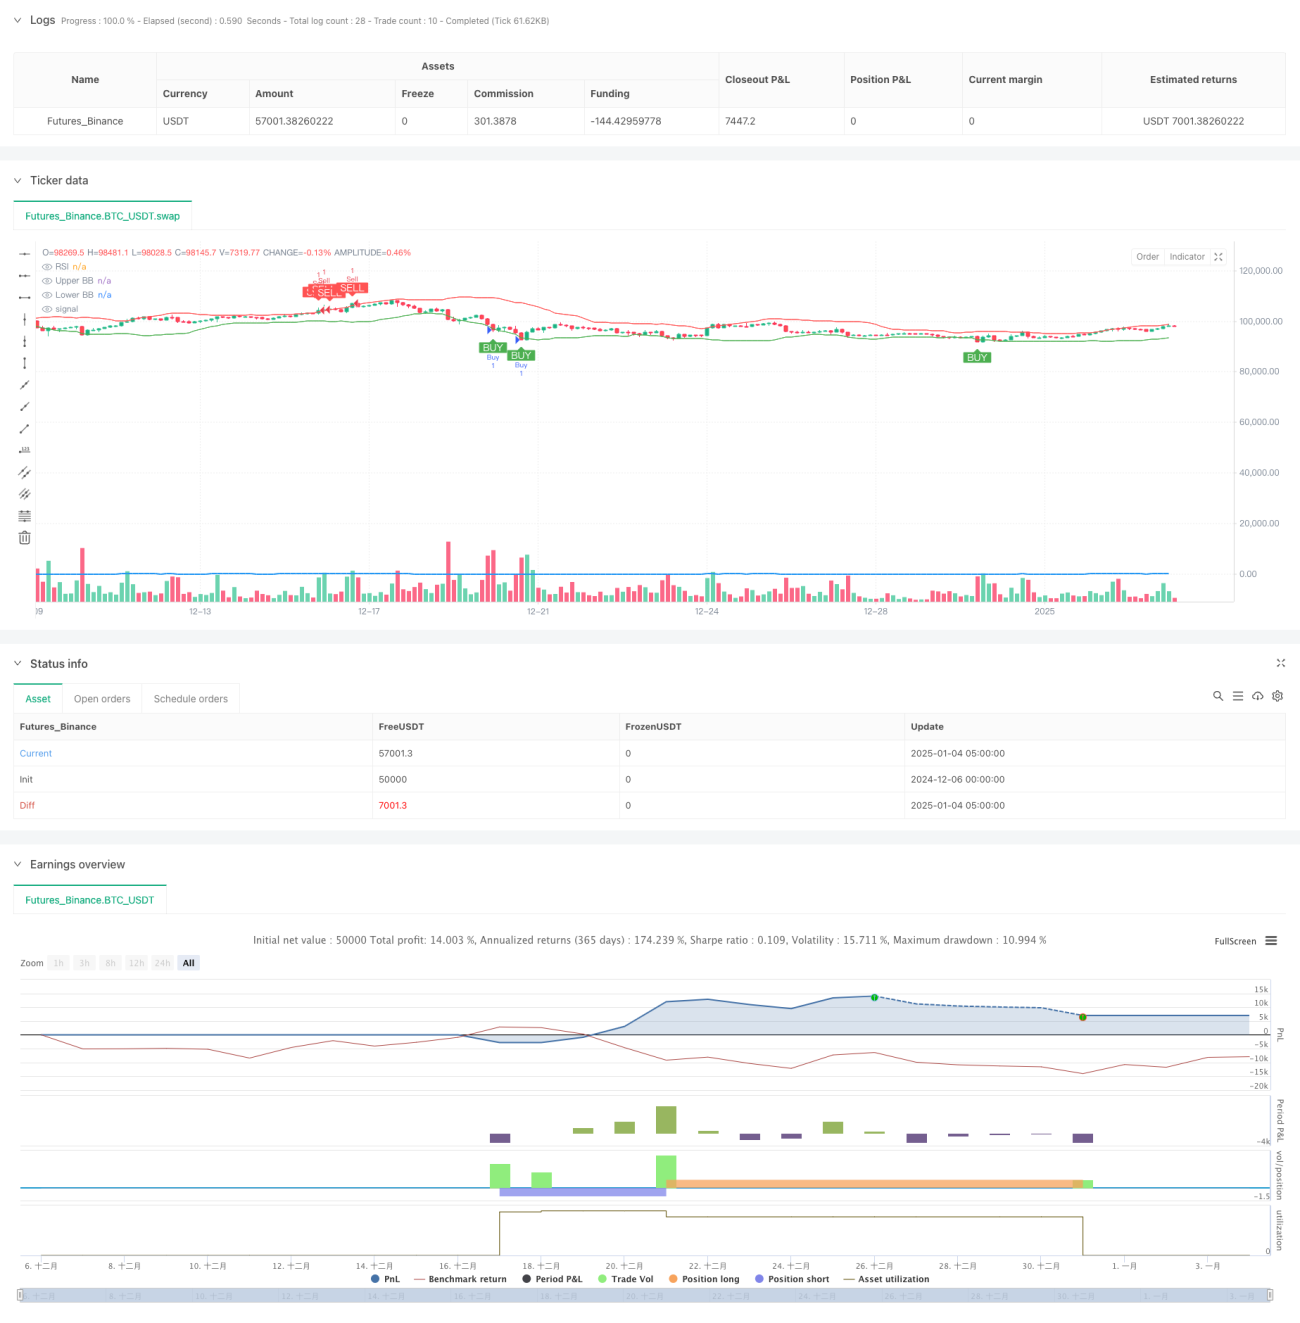
This strategy is a momentum reversal trading system combining RSI and Bollinger Bands indicators, designed to identify overbought and oversold areas. It implements a 1:2 risk-reward ratio with trailing stop loss for risk management. The core logic is to execute trades when both RSI and Bollinger Bands show oversold or overbought signals simultaneously, protecting capital through strict risk management.
Strategy Principles
The strategy utilizes a 14-period RSI and 20-period Bollinger Bands as primary indicators. Buy conditions require both: RSI below 30 (oversold) and price at or below the lower Bollinger Band. Sell conditions require both: RSI above 70 (overbought) and price at or above the upper Bollinger Band. The system uses 5-bar high/low points for trailing stops, with take profit set at twice the stop loss distance, strictly maintaining a 1:2 risk-reward ratio.
Strategy Advantages
- Dual indicator filtering improves signal quality and reduces false signals
- Combines momentum and volatility indicators for a comprehensive market perspective
- Strict risk control mechanisms including trailing stops and fixed risk-reward ratio
- Fully automated system eliminating emotional interference
- Clear strategy logic that is easy to understand and maintain
Strategy Risks
- May experience frequent stops in trending markets
- Dual conditions might miss some trading opportunities
- Fixed RSI and Bollinger Bands parameters may not suit all market conditions
- Trailing stops might exit positions too early in volatile markets
- Requires proper money management to handle consecutive losses
Optimization Directions
- Implement adaptive parameters mechanism to dynamically adjust indicator settings based on market volatility
- Add trend filter to pause reversal trading during strong trends
- Develop dynamic risk-reward ratio system adjusting to market conditions
- Incorporate volume confirmation to improve signal reliability
- Implement more flexible stop loss mechanisms like trailing stops or time-based exits
Summary
This is a well-structured reversal trading strategy that enhances accuracy through dual technical indicators and employs strict risk management. While simple and intuitive, it contains all key elements required for a mature trading system. Through the suggested optimization directions, the strategy has room for further improvement. For live trading, thorough backtesting and parameter optimization are recommended.
- 1