Multi-Moving Average Cross Trend Following RSI Oscillation Strategy

Overview
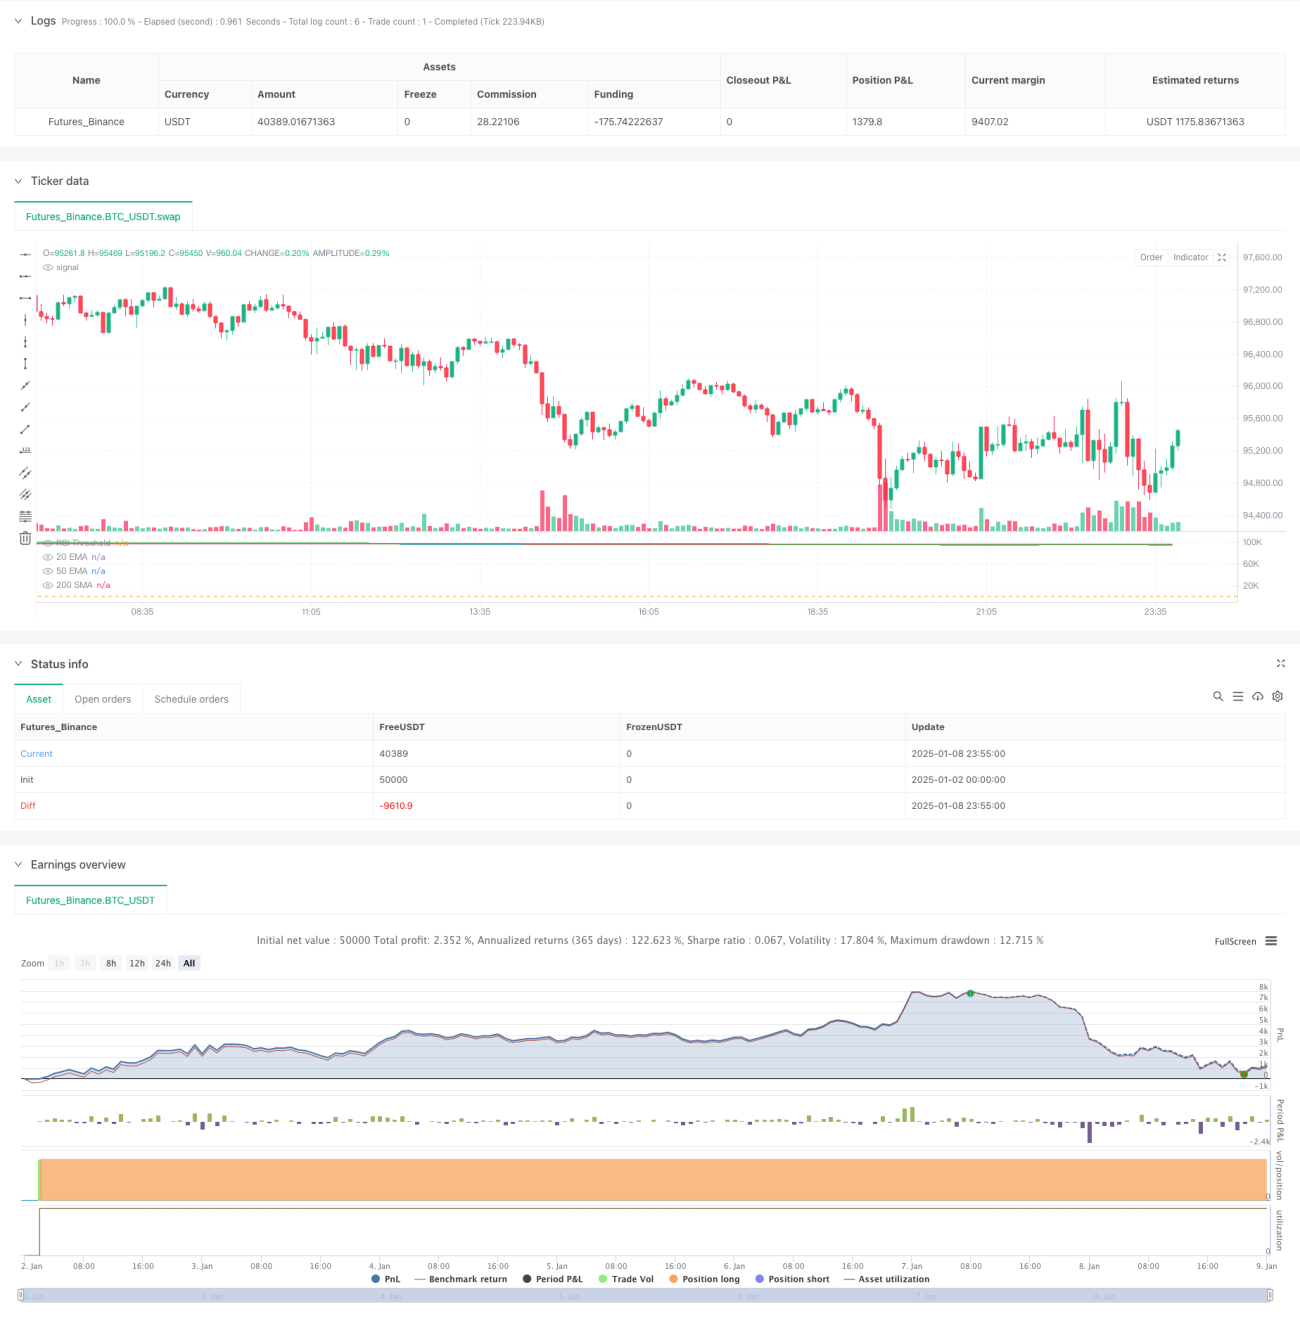
This strategy is a trend following trading system based on multiple moving averages crossover and RSI indicator. It combines EMA20, EMA50, and SMA200 to determine market trends, uses RSI indicator to filter trading signals, and executes trades when price breaks previous highs. The strategy implements fixed take-profit and stop-loss conditions, suitable for 1-hour and daily timeframes.
Strategy Principles
The core logic is based on the following key conditions:
- Trend Determination: EMA20 must be above EMA50, and SMA200 below both EMAs, confirming an uptrend.
- Price Position: Current closing price must be within 1% range of either EMA20 or EMA50, ensuring key support levels.
- RSI Filter: RSI value must be above the set threshold (default 40), filtering for strong markets.
- Entry Trigger: Long position is triggered when price breaks the previous candle's high.
- Risk Management: Sets 25% take-profit and 10% stop-loss levels for risk control.
Strategy Advantages
- Multiple Confirmation Mechanism: Confirms trading signals through multiple dimensions including moving averages, RSI indicator, and price breakouts.
- Strong Trend Following: Uses multiple moving average system to judge medium and long-term trends.
- Comprehensive Risk Management: Sets fixed take-profit and stop-loss ratios for effective risk control.
- Good Adaptability: Strategy parameters can be adjusted to adapt to different market conditions.
- Clear Execution: Entry and exit conditions are well-defined and easy to implement programmatically.
Strategy Risks
- Choppy Market Risk: May generate frequent false signals in sideways markets.
- Lag Risk: Moving average system has inherent lag, potentially missing optimal entry points.
- Stop Loss Range Risk: Fixed stop-loss percentage may not suit all market conditions.
- Drawdown Risk: May face significant drawdowns during trend reversals.
Strategy Optimization Directions
- Dynamic Parameter Optimization: Dynamically adjust moving average periods and RSI threshold based on market volatility.
- Market Environment Recognition: Add market environment identification mechanism to use different parameter combinations.
- Dynamic Take-Profit/Stop-Loss: Set dynamic levels based on ATR or volatility.
- Volume Analysis Integration: Incorporate volume indicators to improve signal reliability.
- Exit Mechanism Optimization: Design more flexible exit mechanisms to improve profit capture.
Summary
This strategy is a well-structured and logically sound trend following system. Through the combination of multiple technical indicators, it effectively captures market trends while maintaining comprehensive risk management. The strategy has significant room for optimization and can achieve improved stability and profitability through continuous improvement. For medium to long-term traders, this represents a worthwhile strategic framework.
- 1