概述
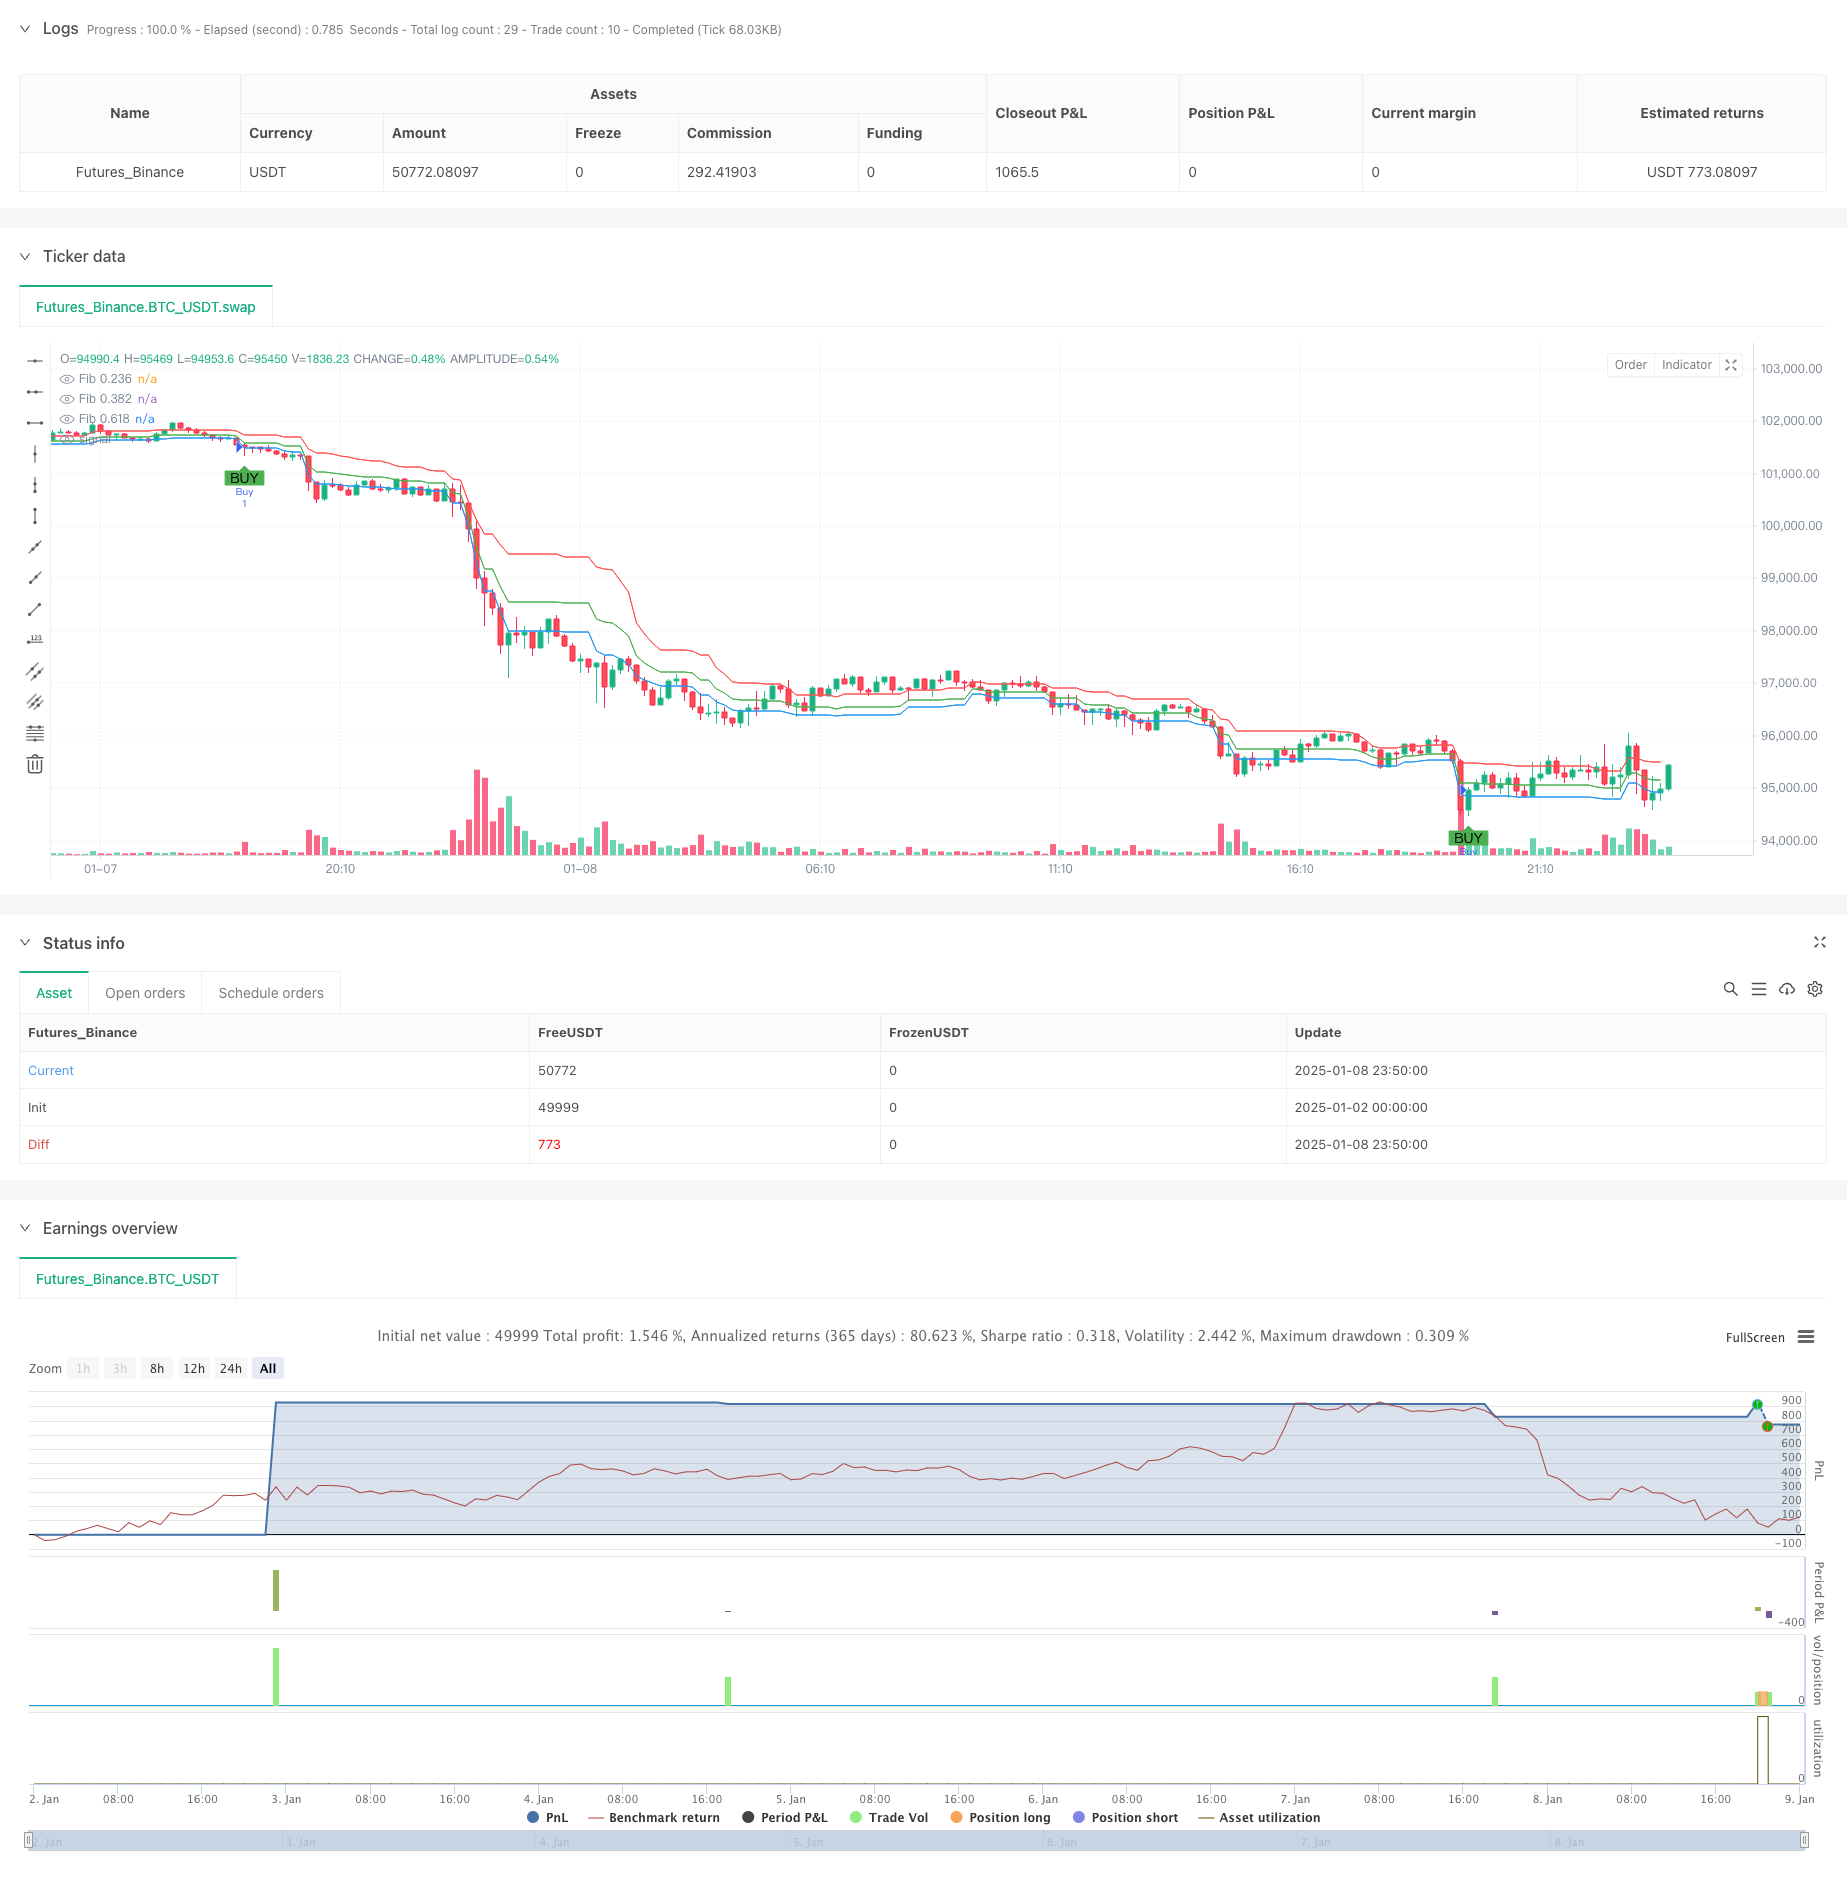
本策略是一个结合布林带和斐波那契回调水平的日内交易系统。它通过布林带指标识别超买超卖状态,同时利用斐波那契回调水平来确认潜在的支撑和阻力位,从而在市场波动中捕捉交易机会。策略采用基于20个周期的布林带和0.236、0.382、0.618三个关键的斐波那契水平进行信号生成。
策略原理
策略的核心逻辑基于以下几个关键要素: 1. 利用布林带上下轨(标准差为2)标识价格的超买超卖区域 2. 通过最近20个周期的最高价和最低价计算斐波那契回调水平 3. 在价格突破布林带下轨且位于斐波那契0.236或0.382支撑位上方时产生买入信号 4. 在价格突破布林带上轨且位于斐波那契0.618阻力位下方时产生卖出信号 5. 使用固定的止损和止盈点数来控制风险和锁定利润
策略优势
- 结合了趋势和支撑阻力的双重确认机制,提高了交易信号的可靠性
- 布林带能够动态适应市场波动率的变化,使策略具有良好的适应性
- 斐波那契水平为入场和出场提供了清晰的参考框架
- 固定的止损止盈设置有助于严格的风险控制
- 策略参数可根据不同市场条件灵活调整
策略风险
- 在震荡市场中可能产生频繁的假突破信号
- 固定的止损止盈设置可能不适合所有市场环境
- 斐波那契水平的有效性受市场结构影响较大
- 在快速趋势市场中,可能错过部分行情
- 需要持续监控和调整参数以适应市场变化
策略优化方向
- 引入成交量指标来确认突破的有效性
- 根据市场波动率动态调整止损止盈水平
- 增加趋势过滤器以避免在横盘市场中交易
- 优化斐波那契水平的计算周期
- 考虑加入时间过滤器以避免在低流动性时段交易
总结
这是一个结合技术分析经典工具的完整交易系统,通过布林带和斐波那契回调的协同作用,为交易者提供了一个系统化的交易框架。虽然存在一定的局限性,但通过适当的参数优化和风险管理,该策略能够在日内交易中发挥良好的效果。关键是要根据具体的交易品种和市场条件进行相应的调整和优化。
策略源码
/*backtest
start: 2025-01-02 00:00:00
end: 2025-01-09 00:00:00
period: 10m
basePeriod: 10m
exchanges: [{"eid":"Futures_Binance","currency":"BTC_USDT","balance":49999}]
*/

//@version=5
strategy("Bollinger Bands and Fibonacci Intraday Strategy", overlay=true)

// Bollinger Bands settings
length = input.int(20, title="Bollinger Band Length")
src = close
mult = input.float(2.0, title="Bollinger Band Multiplier")
basis = ta.sma(src, length)
dev = mult * ta.stdev(src, length)
upper = basis + dev
lower = basis - dev

// Fibonacci retracement levels
fibRetrace1 = input.float(0.236, title="Fibonacci Level 0.236")
fibRetrace2 = input.float(0.382, title="Fibonacci Level 0.382")
fibRetrace3 = input.float(0.618, title="Fibonacci Level 0.618")

// Define the Fibonacci levels based on recent high and low
var float fibLow = na
var float fibHigh = na

if (bar_index == 0 or ta.highest(high, 20) != fibHigh or ta.lowest(low, 20) != fibLow)
    fibHigh := ta.highest(high, 20)
    fibLow := ta.lowest(low, 20)

fibLevel1 = fibLow + (fibHigh - fibLow) * fibRetrace1
fibLevel2 = fibLow + (fibHigh - fibLow) * fibRetrace2
fibLevel3 = fibLow + (fibHigh - fibLow) * fibRetrace3

// Plot Fibonacci levels on the chart
plot(fibLevel1, title="Fib 0.236", color=color.blue, linewidth=1)
plot(fibLevel2, title="Fib 0.382", color=color.green, linewidth=1)
plot(fibLevel3, title="Fib 0.618", color=color.red, linewidth=1)

// Buy and Sell conditions
buyCondition = close < lower and close > fibLevel1
sellCondition = close > upper and close < fibLevel3

// Plot Buy and Sell signals
plotshape(buyCondition, title="Buy Signal", location=location.belowbar, color=color.green, style=shape.labelup, text="BUY")
plotshape(sellCondition, title="Sell Signal", location=location.abovebar, color=color.red, style=shape.labeldown, text="SELL")

// Execute strategy
if (buyCondition)
    strategy.entry("Buy", strategy.long)

if (sellCondition)
    strategy.entry("Sell", strategy.short)

// Exit strategy with stop loss and take profit
stopLoss = input.float(50, title="Stop Loss (pips)", minval=1)
takeProfit = input.float(100, title="Take Profit (pips)", minval=1)

strategy.exit("Exit Buy", "Buy", stop=close - stopLoss * syminfo.mintick, limit=close + takeProfit * syminfo.mintick)
strategy.exit("Exit Sell", "Sell", stop=close + stopLoss * syminfo.mintick, limit=close - takeProfit * syminfo.mintick)
相关推荐